ABIT is an activity-based agent-based transport model developed by the Professorship of Travel Behavior at the Technical University of Munich. It generates week-long activity-travel schedules for every person in the study area and updates incrementally over time by integrating a land use model. The activity-travel schedule generated by ABIT is a tour plan consisting of chains of activities and legs between activities over a weekly period. Simulated activities do not overlap, so individuals can only be in one location at any given time.
This wiki page provides the following information about ABIT:
- Scope of the model
- Methodology
- Behavior modules and model calibration
- Model validation
- Output analysis
- Policy scenarios
- Publication
If you would like more information, please read this open-access article or refer to this model flowchart (See it on our Miro board).
Scope of the model
- Time horizon and steps: ABIT simulates activity frequencies and travel demand during a typical week to capture the day-to-day variations, especially between weekdays and weekends. Regarding time steps, ABIT simulates activity and travel demand continuously in time per 5 minutes.
- Activity demand and purposes: ABIT considers only out-of-home activities that induce individuals' travel demand. In-home activities like online shopping and working from home are not considered. Currently, ABIT distinguishes eight types of activities as below:
- Home
- Work: mandatory activity
- Education: mandatory activity
- Accompany: discretionary activity
- Shopping: discretionary activity
- Recreation: discretionary activity
- Other: discretionary activity
- Subtour
Based on the rigidity of the space and time constraints of different activity purposes, we classified work and education as mandatory activities and accompanying, shopping, recreation, and other activities as discretionary activities.
- Mode: ABIT considers most regional and urban travel modes and distinguishes them into two mode sets: habitual mode and tour mode.
- Habitual mode: the mode that the employed population and students use for commuting. Unemployed and non-student populations default to the unknown in their habitual modes.
- Car driver
- Car passenger
- Public transport: includes all types of public transport.
- Bike
- Walk
- Unknown: default for the unemployed and non-student population.
- Tour/leg mode: the mode that each person selects when traveling between different activity locations.
- Car driver
- Car passenger
- Train
- Metro and tram: subway and street car.
- Bus
- Bike
- Walk
- Habitual mode: the mode that the employed population and students use for commuting. Unemployed and non-student populations default to the unknown in their habitual modes.
- Study area:
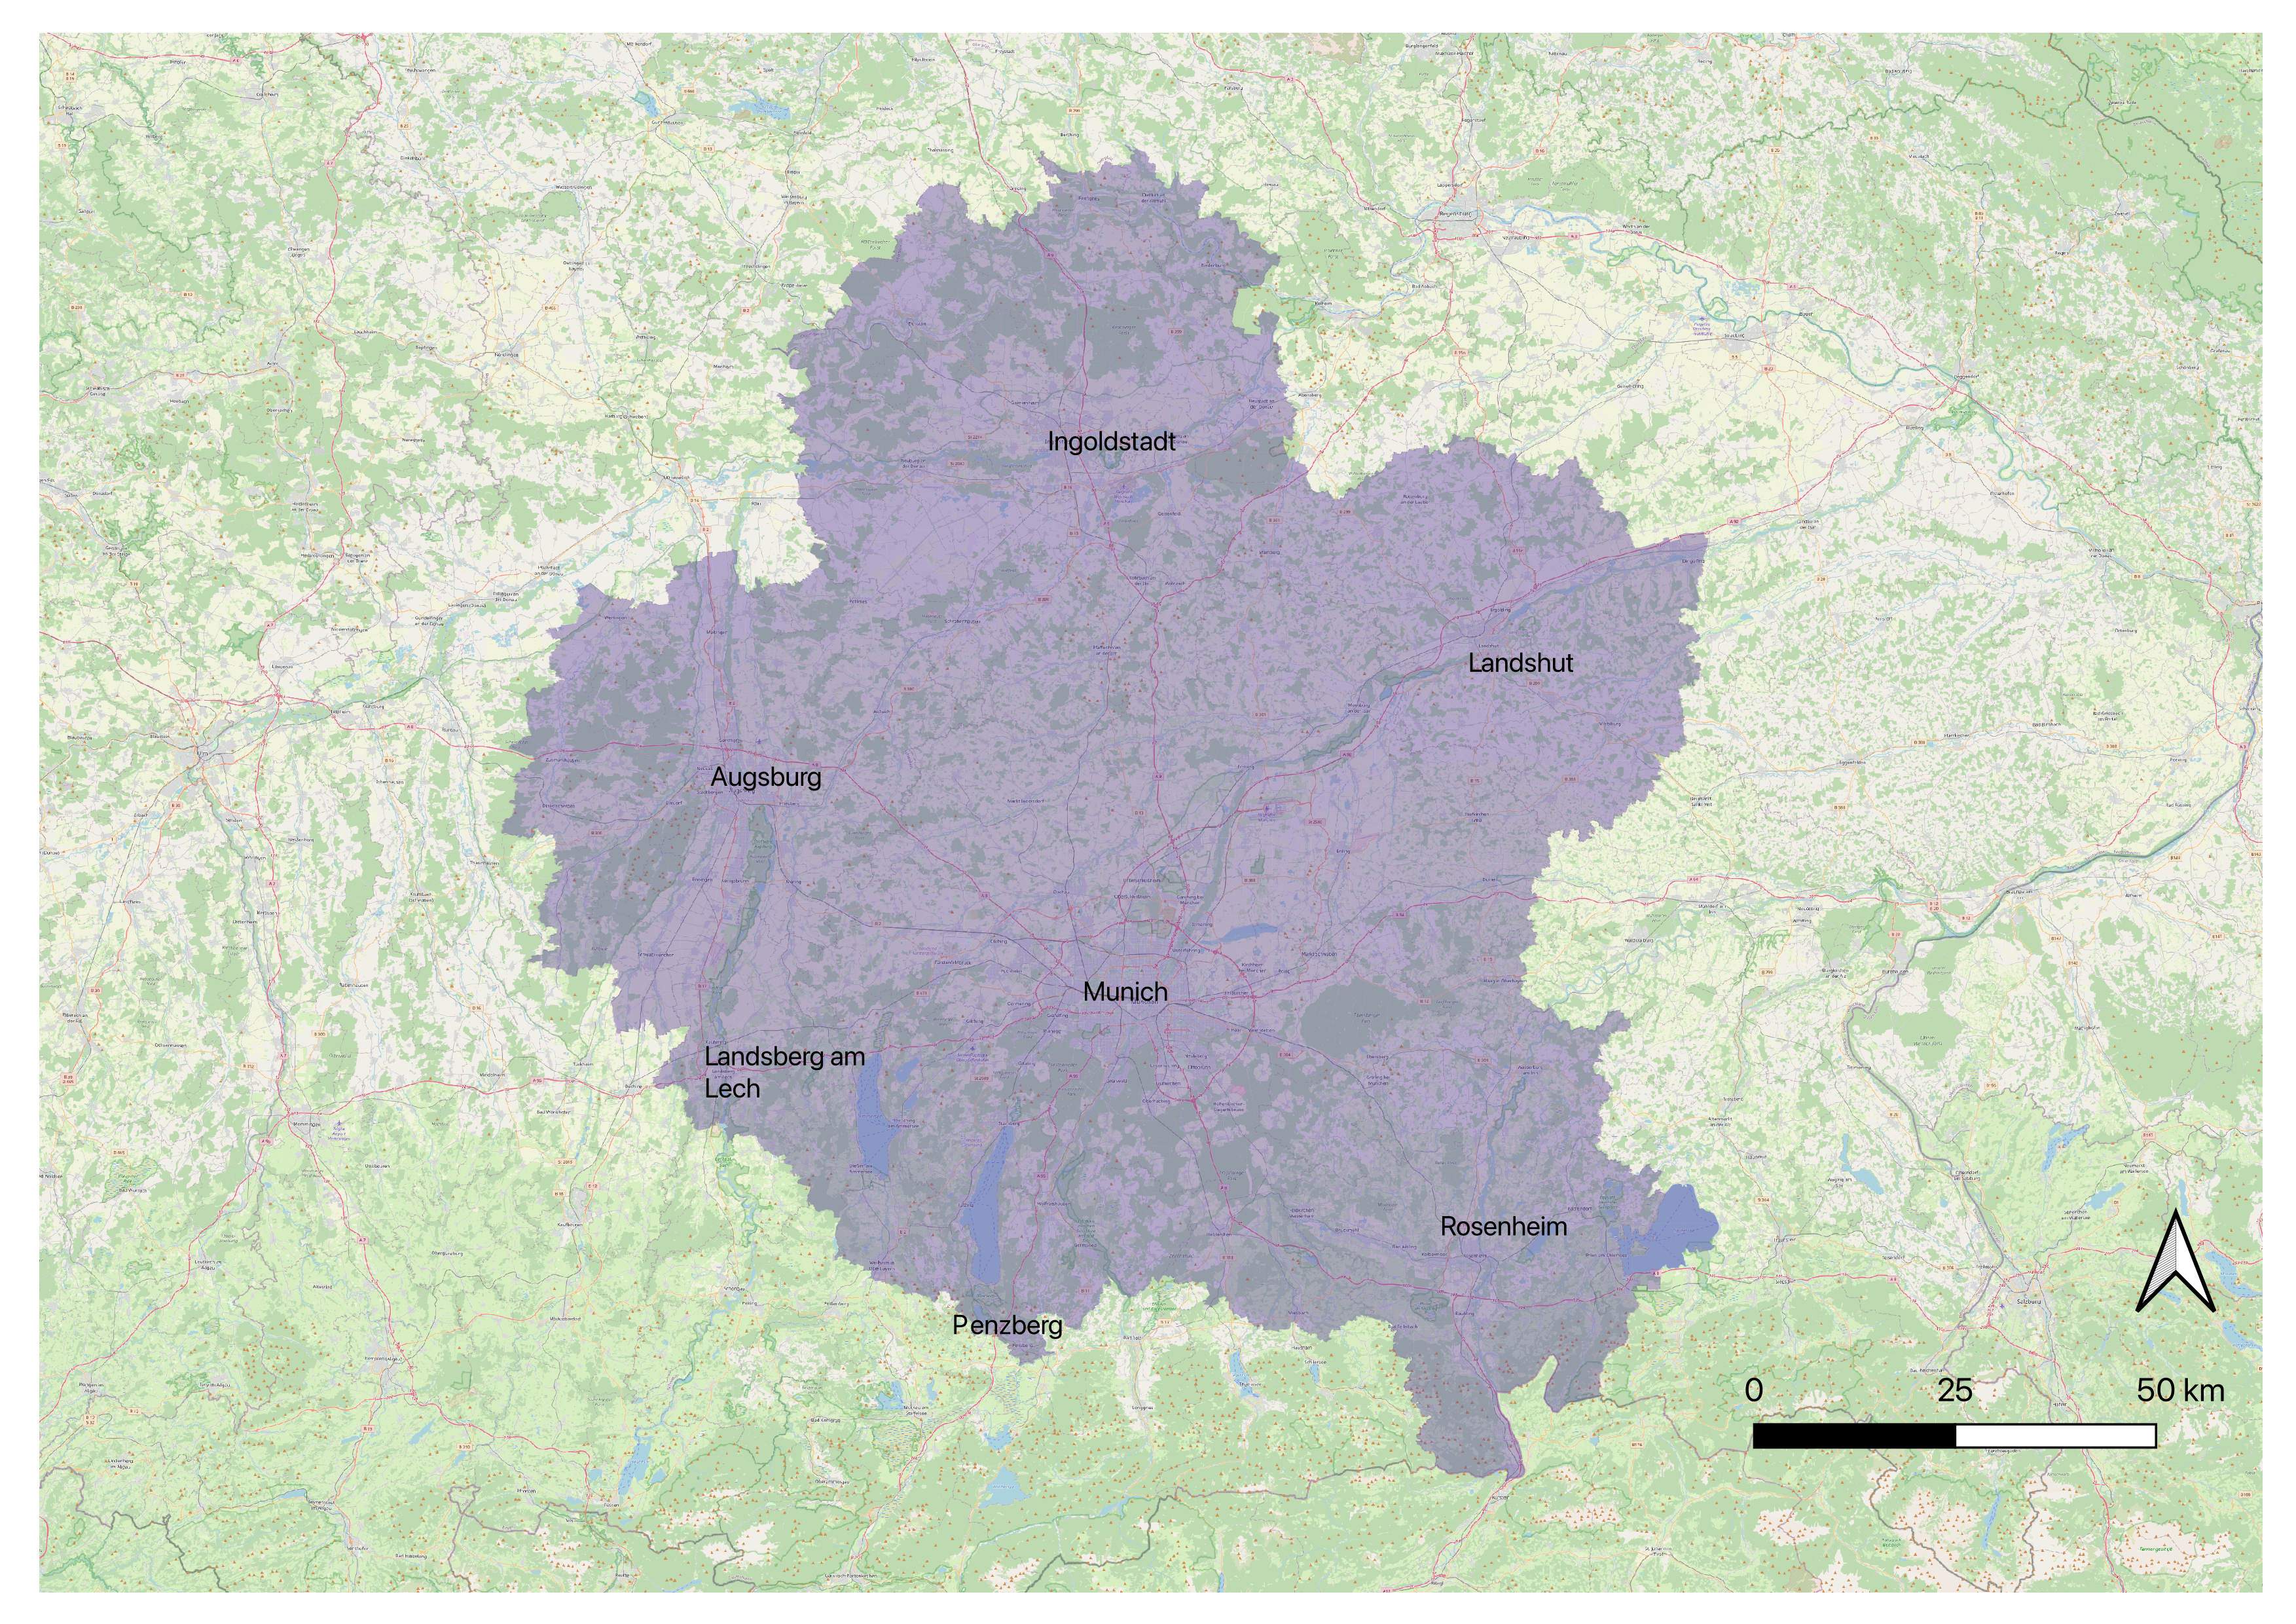
As the figure below shows, ABIT is implemented in the City of Munich and its surrounding metropolitan areas. This means that the activity and travel demands of the population living in the study area are generated. The study area is divided into 4,953 traffic analysis zones (TAZ). Both intra- and inter-zonal demands are simulated.
- Development status: base-year demand generation is completed within the project framework. Incremental updating for future-year forecasting is under development. Please refer to the next section for information on base-year demand generation and incremental updating in future years.
- Access: ABIT is an open-access software; the source code can be found here.
The above properties can be modified and customized according to policy analysis needs. We also look forward to collaboration opportunities in implementing ABIT in other places. For more information, please feel free to reach out for further discussions.
Methodology
The modeling methodology consists of base-year demand generation and future-year updating/forecasting.
- Base-year demand generation
ABIT is designed to take advantage of this opportunity by modeling habitual travel behavior and modeling peoples' weekly schedules using multiple behavioral models in sequential order. The figure below shows the model flow of ABIT. Aside from vehicle usage (step 7), which is assigned at the household level, all other steps of plan generation are currently for each person within each household. The plan is generated with the following steps:
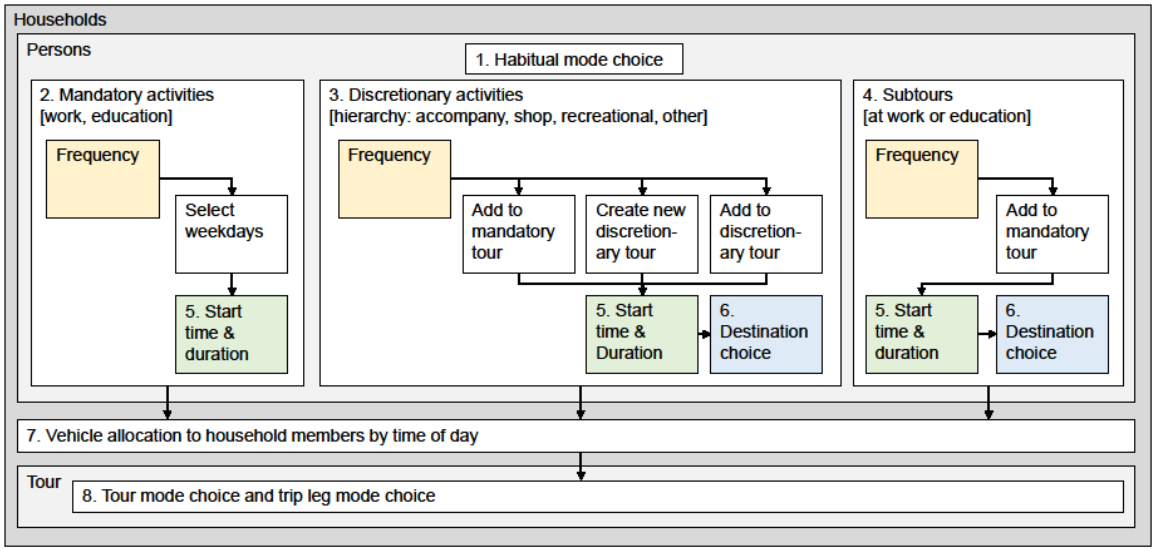
- Habitual mode: Each agent is assigned a habitual mode, the transport mode they use most frequently to reach mandatory activities (e.g., work and education) over one week. The habitual mode affects activity generation, tour chaining, destination choice, and mode choice model.
- Mandatory activities: For each agent, the weekly number of mandatory activities (work and education) is selected and assigned to a day of the week. Because more than one mandatory activity is conducted on the same day, the model simplifies agents' conduct to one mandatory tour per day with a maximum of seven per week.
- Discretionary activities: The number of discretionary activities by purpose is selected for each agent. However, the frequency of each activity purpose is estimated independently, and a hierarchy of purposes is predefined, so the allocation of specific purposes is given higher priority than others. The hierarchy is as follows: Accompany, Shop, Other, Recreation. After frequency generation, each activity is either added as a stop on an existing tour or used to create a new tour. For each discretionary activity, the following steps are performed according to the purpose hierarchy:
First, discretionary acts are distinguished as either a stop attached to a mandatory tour or not.
Second, the discretionary activities not categorized as mandatory tour stops are designated as either a stop on an existing discretionary tour or the main activity of a discretionary tour.
- Subtours: for mandatory tours, the model may add subtours that start and end at the mandatory activity. Subtours are not further distinguished by purpose but are described by their start time and duration.
- Duration and start time: For mandatory activities, the duration and start time are given as part of the synthetic population's job or school attributes. For discretionary activities, the duration is selected first, and then a weekday and time of day are selected probabilistically within this agent's available time window. For subtours, the start time and duration of subtours are based on the probability distribution from MOP data.
- Destination choice: In addition to the home, work, and education locations inherited from the synthetic population, each discretionary activity is assigned a location. Destination choice depends on the attractiveness of potential locations and the travel impedance either from the home location (for the main activities) or from the locations of activities immediately before and after (for stops).
- Vehicle allocation: at the household level, rules are implemented to account for vehicle availability. For each tour made by a household member, travel times by auto and transit are compared. Among all household members with a driver’s license, the car is made available for the agent with the largest benefit of using a car over transit. If an agent chooses to drive, one household car is made unavailable to other household members for the duration of the tour.
- Mode choice: Using a nested logit model, a mode is assigned for each person's tour. Typically, the trip legs of the tour use the same mode as the tour, but those using transit may also walk for selected legs. Notably, sub tours have a chance to be conducted by walking instead of using the main tour mode.
(The description above describes the general ideas of base-year demand generation; please refer to the next section for more description of the data used and econometric model specification.)
- Future-year updating/forecasting
Increment updating the travel demand from the base year to a targeted future year is an essential function in modeling the impacts of transport policies.
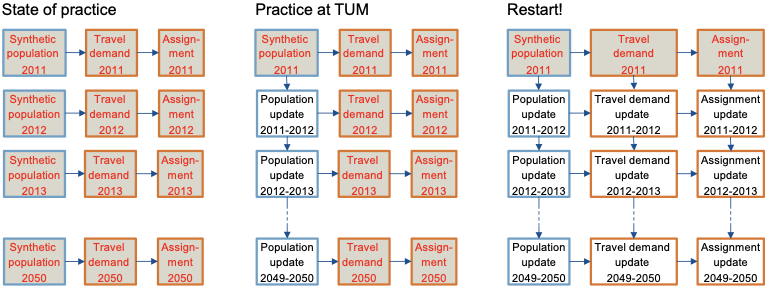
The state of the practice for future-year travel demand is shown below (left). TUM TB has a land-use model for updating the synthetic population, improving the plausibility of future-year forecasting (middle). Nevertheless, the travel behavior from the previous year does not carry from the former year to the following year, which means the habitual behavior cannot be replicated. That's why ABIT is designed to the framework on the right, which takes not only the properties of the synthetic population from the previous year but also their travel behavior, which should contribute to more stable travel demand modeling and tracing the long-term impact on individuals.
Behavioral modules and model calibration
The ABIT model consists of multiple behavioral models that simulate individuals' weekly schedules; the following table provides an overview of the behavioral modules.
| Model | Purpose* | Dependent variable | Model type | Data source** | Model outcome | |||||||||||||||||||||||||||||||||||||||||||||||||||||||||||||||||||||||||||||||||||||||||||||||||||||||||||||||||||||||||||||||||||||||||||||||||||||||||||||||||||||||||||||||||||||||||||||||||
|---|---|---|---|---|---|---|---|---|---|---|---|---|---|---|---|---|---|---|---|---|---|---|---|---|---|---|---|---|---|---|---|---|---|---|---|---|---|---|---|---|---|---|---|---|---|---|---|---|---|---|---|---|---|---|---|---|---|---|---|---|---|---|---|---|---|---|---|---|---|---|---|---|---|---|---|---|---|---|---|---|---|---|---|---|---|---|---|---|---|---|---|---|---|---|---|---|---|---|---|---|---|---|---|---|---|---|---|---|---|---|---|---|---|---|---|---|---|---|---|---|---|---|---|---|---|---|---|---|---|---|---|---|---|---|---|---|---|---|---|---|---|---|---|---|---|---|---|---|---|---|---|---|---|---|---|---|---|---|---|---|---|---|---|---|---|---|---|---|---|---|---|---|---|---|---|---|---|---|---|---|---|---|---|---|---|---|---|---|---|---|---|---|---|---|---|---|---|---|
| 1 | Habitual mode choice | No purpose | Habitual mode | Nested logit model
| MOP |
Errors are controlled to +- 2 percentage points compared with observation. | ||||||||||||||||||||||||||||||||||||||||||||||||||||||||||||||||||||||||||||||||||||||||||||||||||||||||||||||||||||||||||||||||||||||||||||||||||||||||||||||||||||||||||||||||||||||||||||||||
| 2 | Activity generation | Mandatory | Number of days with activity per week | Zero Inflated Model (Binary logit + Ordered logit) | MOP |
Errors are controlled to +- 2.4 percentage points compared with observation. | ||||||||||||||||||||||||||||||||||||||||||||||||||||||||||||||||||||||||||||||||||||||||||||||||||||||||||||||||||||||||||||||||||||||||||||||||||||||||||||||||||||||||||||||||||||||||||||||||
| 3 | Activity generation | Discretionary (accompany and recreational round trips) | Number of activities per week | Zero Inflated Model (Binary logit +Negative Binomial) | MOP |
Errors are controlled to +- 2.4 percentage points compared with observation. Recreational round trips are not considered in this project. | ||||||||||||||||||||||||||||||||||||||||||||||||||||||||||||||||||||||||||||||||||||||||||||||||||||||||||||||||||||||||||||||||||||||||||||||||||||||||||||||||||||||||||||||||||||||||||||||||
| 4 | Activity generation | Discretionary (shopping, recreation and other) | Number of activities per week | Negative Binomial | MOP |
Errors are controlled to +- 3.5 percentage points compared with observation. | ||||||||||||||||||||||||||||||||||||||||||||||||||||||||||||||||||||||||||||||||||||||||||||||||||||||||||||||||||||||||||||||||||||||||||||||||||||||||||||||||||||||||||||||||||||||||||||||||
| 5 | Split into stops on mandatory tour and other | Discretionary | Mandatory stop or other | Binary logit | MOP |
Errors are controlled to +- 1.0 percentage points compared with observation. | ||||||||||||||||||||||||||||||||||||||||||||||||||||||||||||||||||||||||||||||||||||||||||||||||||||||||||||||||||||||||||||||||||||||||||||||||||||||||||||||||||||||||||||||||||||||||||||||||
| 6 | Split discretionary activities on discretionary tours | Discretionary | Primary or stop on discretionary | Binary and multinomial logit | MOP |
Errors are controlled to +- 1.0 percentage points compared with observation.
Errors are controlled to +- 2.5 percentage points compared with observation.
Errors are controlled to +- 2.5 percentage points compared with observation.
Errors are controlled to +- 4.0 percentage points compared with observation. | ||||||||||||||||||||||||||||||||||||||||||||||||||||||||||||||||||||||||||||||||||||||||||||||||||||||||||||||||||||||||||||||||||||||||||||||||||||||||||||||||||||||||||||||||||||||||||||||||
| 7 | Split into stop before/stop after | Discretionary | Before or after | Weighted sampling based on start time cumulative probability | MOP | |||||||||||||||||||||||||||||||||||||||||||||||||||||||||||||||||||||||||||||||||||||||||||||||||||||||||||||||||||||||||||||||||||||||||||||||||||||||||||||||||||||||||||||||||||||||||||||||||
| 8 | Main activity destination choice | Discretionary (and mandatory if no information exists) | Destination zone | Multinomial logit (based on distance to home) | MOP (only for calibration to match trip distances) | Please see MITO. | ||||||||||||||||||||||||||||||||||||||||||||||||||||||||||||||||||||||||||||||||||||||||||||||||||||||||||||||||||||||||||||||||||||||||||||||||||||||||||||||||||||||||||||||||||||||||||||||||
| 9 | Stop destination choice | Discretionary (and mandatory if no information exists) | Destination zone | Multinomial logit (based on distance to previous and after activities) | MOP (only for calibration to match trip distances) |
Errors are controlled to +- 1.0 kilometers compared with observation. | ||||||||||||||||||||||||||||||||||||||||||||||||||||||||||||||||||||||||||||||||||||||||||||||||||||||||||||||||||||||||||||||||||||||||||||||||||||||||||||||||||||||||||||||||||||||||||||||||
| 10 | Start time and duration | All | Start time and duration | Weighted sampling from empirical distributions (joint duration and start distributions) | MOP | |||||||||||||||||||||||||||||||||||||||||||||||||||||||||||||||||||||||||||||||||||||||||||||||||||||||||||||||||||||||||||||||||||||||||||||||||||||||||||||||||||||||||||||||||||||||||||||||||
| 11 | Tour mode choice | Mandatory | Mode | Nested logit
| MOP/MiD |
Errors are controlled to +- 2 percentage points compared with observation.
Errors are controlled to +- 2 percentage points compared with observation. | ||||||||||||||||||||||||||||||||||||||||||||||||||||||||||||||||||||||||||||||||||||||||||||||||||||||||||||||||||||||||||||||||||||||||||||||||||||||||||||||||||||||||||||||||||||||||||||||||
| 12 | Tour mode choice | Discretionary | Mode | Nested logit
| MOP/MiD |
Errors are controlled to +- 2 percentage points compared with observation.
Errors are controlled to +- 2 percentage points compared with observation.
Errors are controlled to +- 2 percentage points compared with observation.
Errors are controlled to +- 2 percentage points compared with observation.
Errors are controlled to +- 2 percentage points compared with observation.
Errors are controlled to +- 2 percentage points compared with observation.
Errors are controlled to +- 2 percentage points compared with observation.
Errors are controlled to +- 2 percentage points compared with observation. | ||||||||||||||||||||||||||||||||||||||||||||||||||||||||||||||||||||||||||||||||||||||||||||||||||||||||||||||||||||||||||||||||||||||||||||||||||||||||||||||||||||||||||||||||||||||||||||||||
| 13 | Subtour generation | Subtour | Makes subtour or not | Binary logit | MOP |
Errors are controlled to +- 2 percentage points compared with observation. | ||||||||||||||||||||||||||||||||||||||||||||||||||||||||||||||||||||||||||||||||||||||||||||||||||||||||||||||||||||||||||||||||||||||||||||||||||||||||||||||||||||||||||||||||||||||||||||||||
| 14 | Subtour duration and start time | Subtour | Start time and duration | Weighted sampling from empirical distributions (joint duration and start distributions) | MOP | |||||||||||||||||||||||||||||||||||||||||||||||||||||||||||||||||||||||||||||||||||||||||||||||||||||||||||||||||||||||||||||||||||||||||||||||||||||||||||||||||||||||||||||||||||||||||||||||||
| 15 | Subtour destination | Subtour | Destination zone | Gravity model | MOP |
Errors are controlled to +- 1.0 kilometers compared with observation. | ||||||||||||||||||||||||||||||||||||||||||||||||||||||||||||||||||||||||||||||||||||||||||||||||||||||||||||||||||||||||||||||||||||||||||||||||||||||||||||||||||||||||||||||||||||||||||||||||
| 16 | Subtour mode choice | Subtour | Change to walk/Remain as main mode | Binary logit model | MOP |
Errors are controlled to +- 2 percentage points compared with observation. |
**MID: Germany household travel survey.
**MOP: German Mobility Panel data.
Model validation
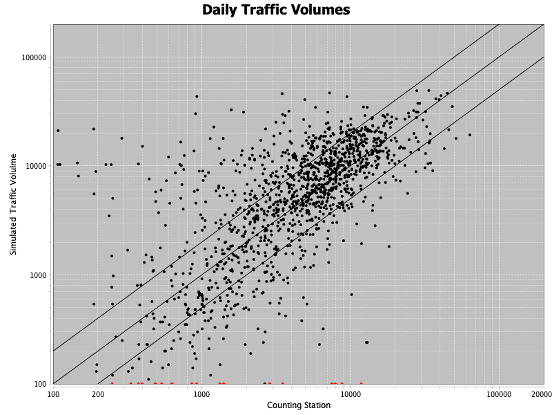
Before using the model for scenario analysis, the simulated travel demand generated by ABIT will be validated with traffic count data. This work is still ongoing and will be updated after FTM provides the count data for model validation.
| Unit | Observed traffic | Simulated traffic | RMSE | RMSPE | Correlation |
|---|---|---|---|---|---|
| Daily traffic volume | |||||
| Hourly traffic volume |
Base-year analysis
We summarized some of the ABIT output analysis results to show its policy analysis capability.
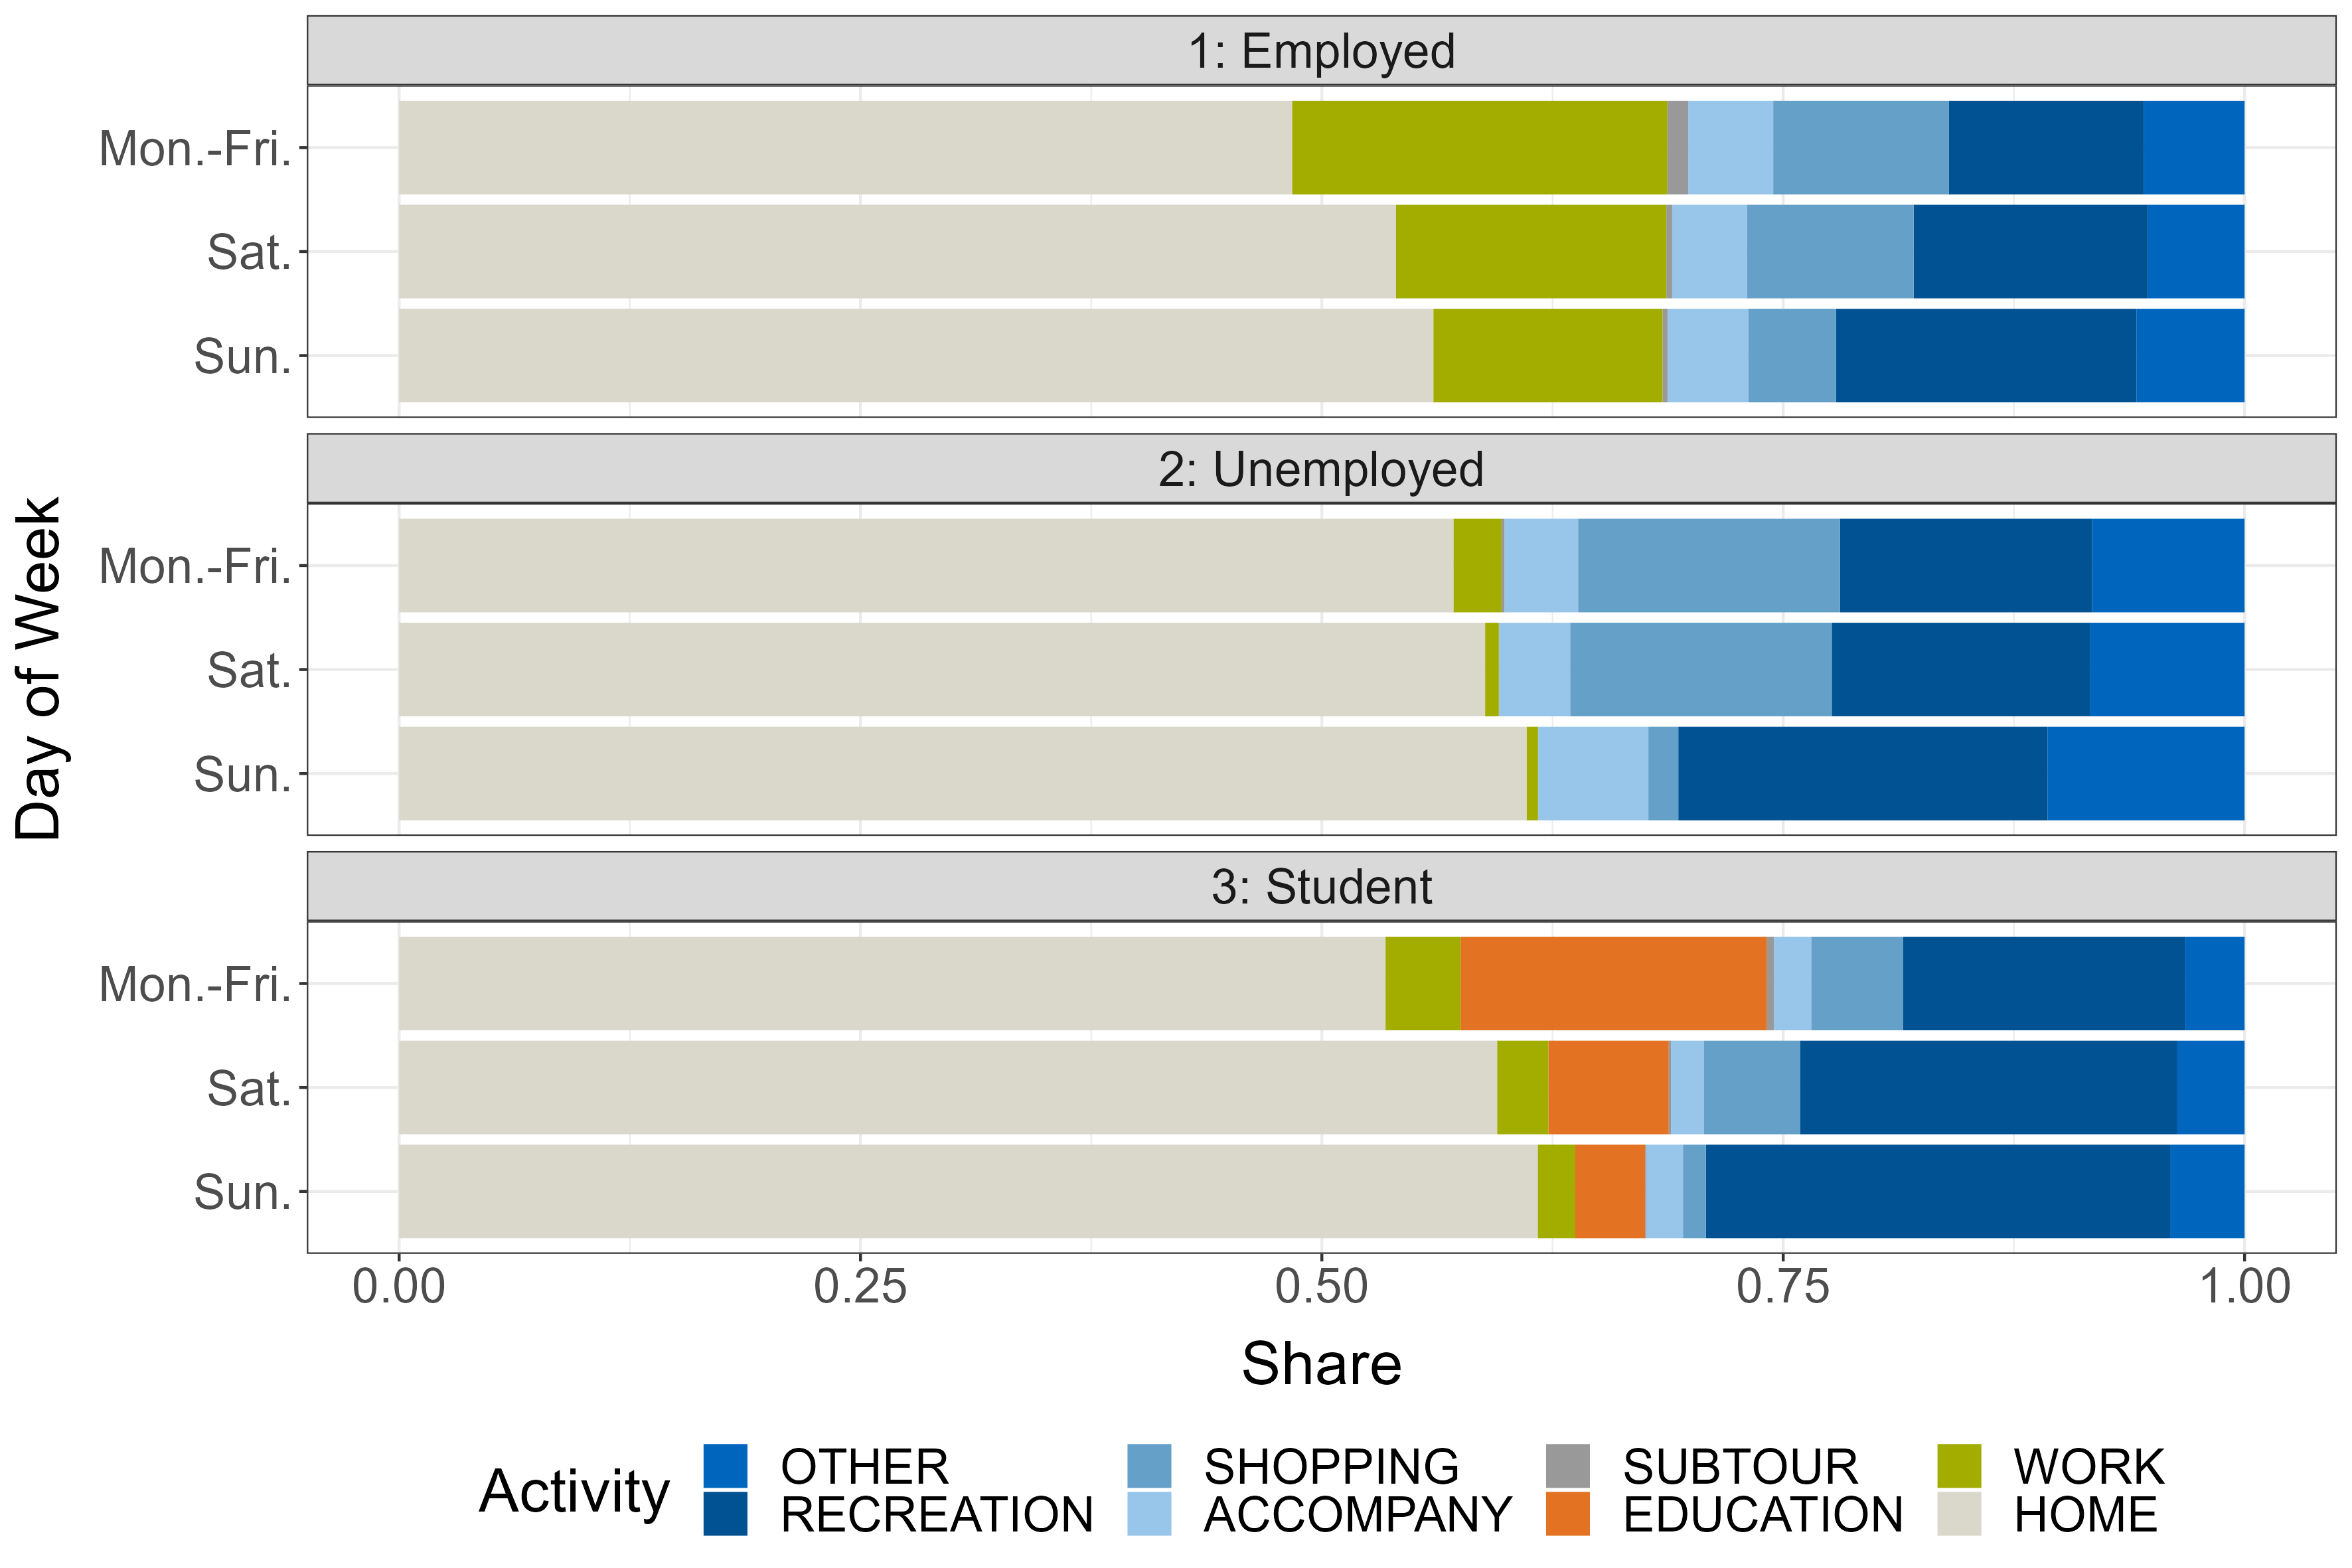
Distribution of time use by occupation, purpose, and day of week
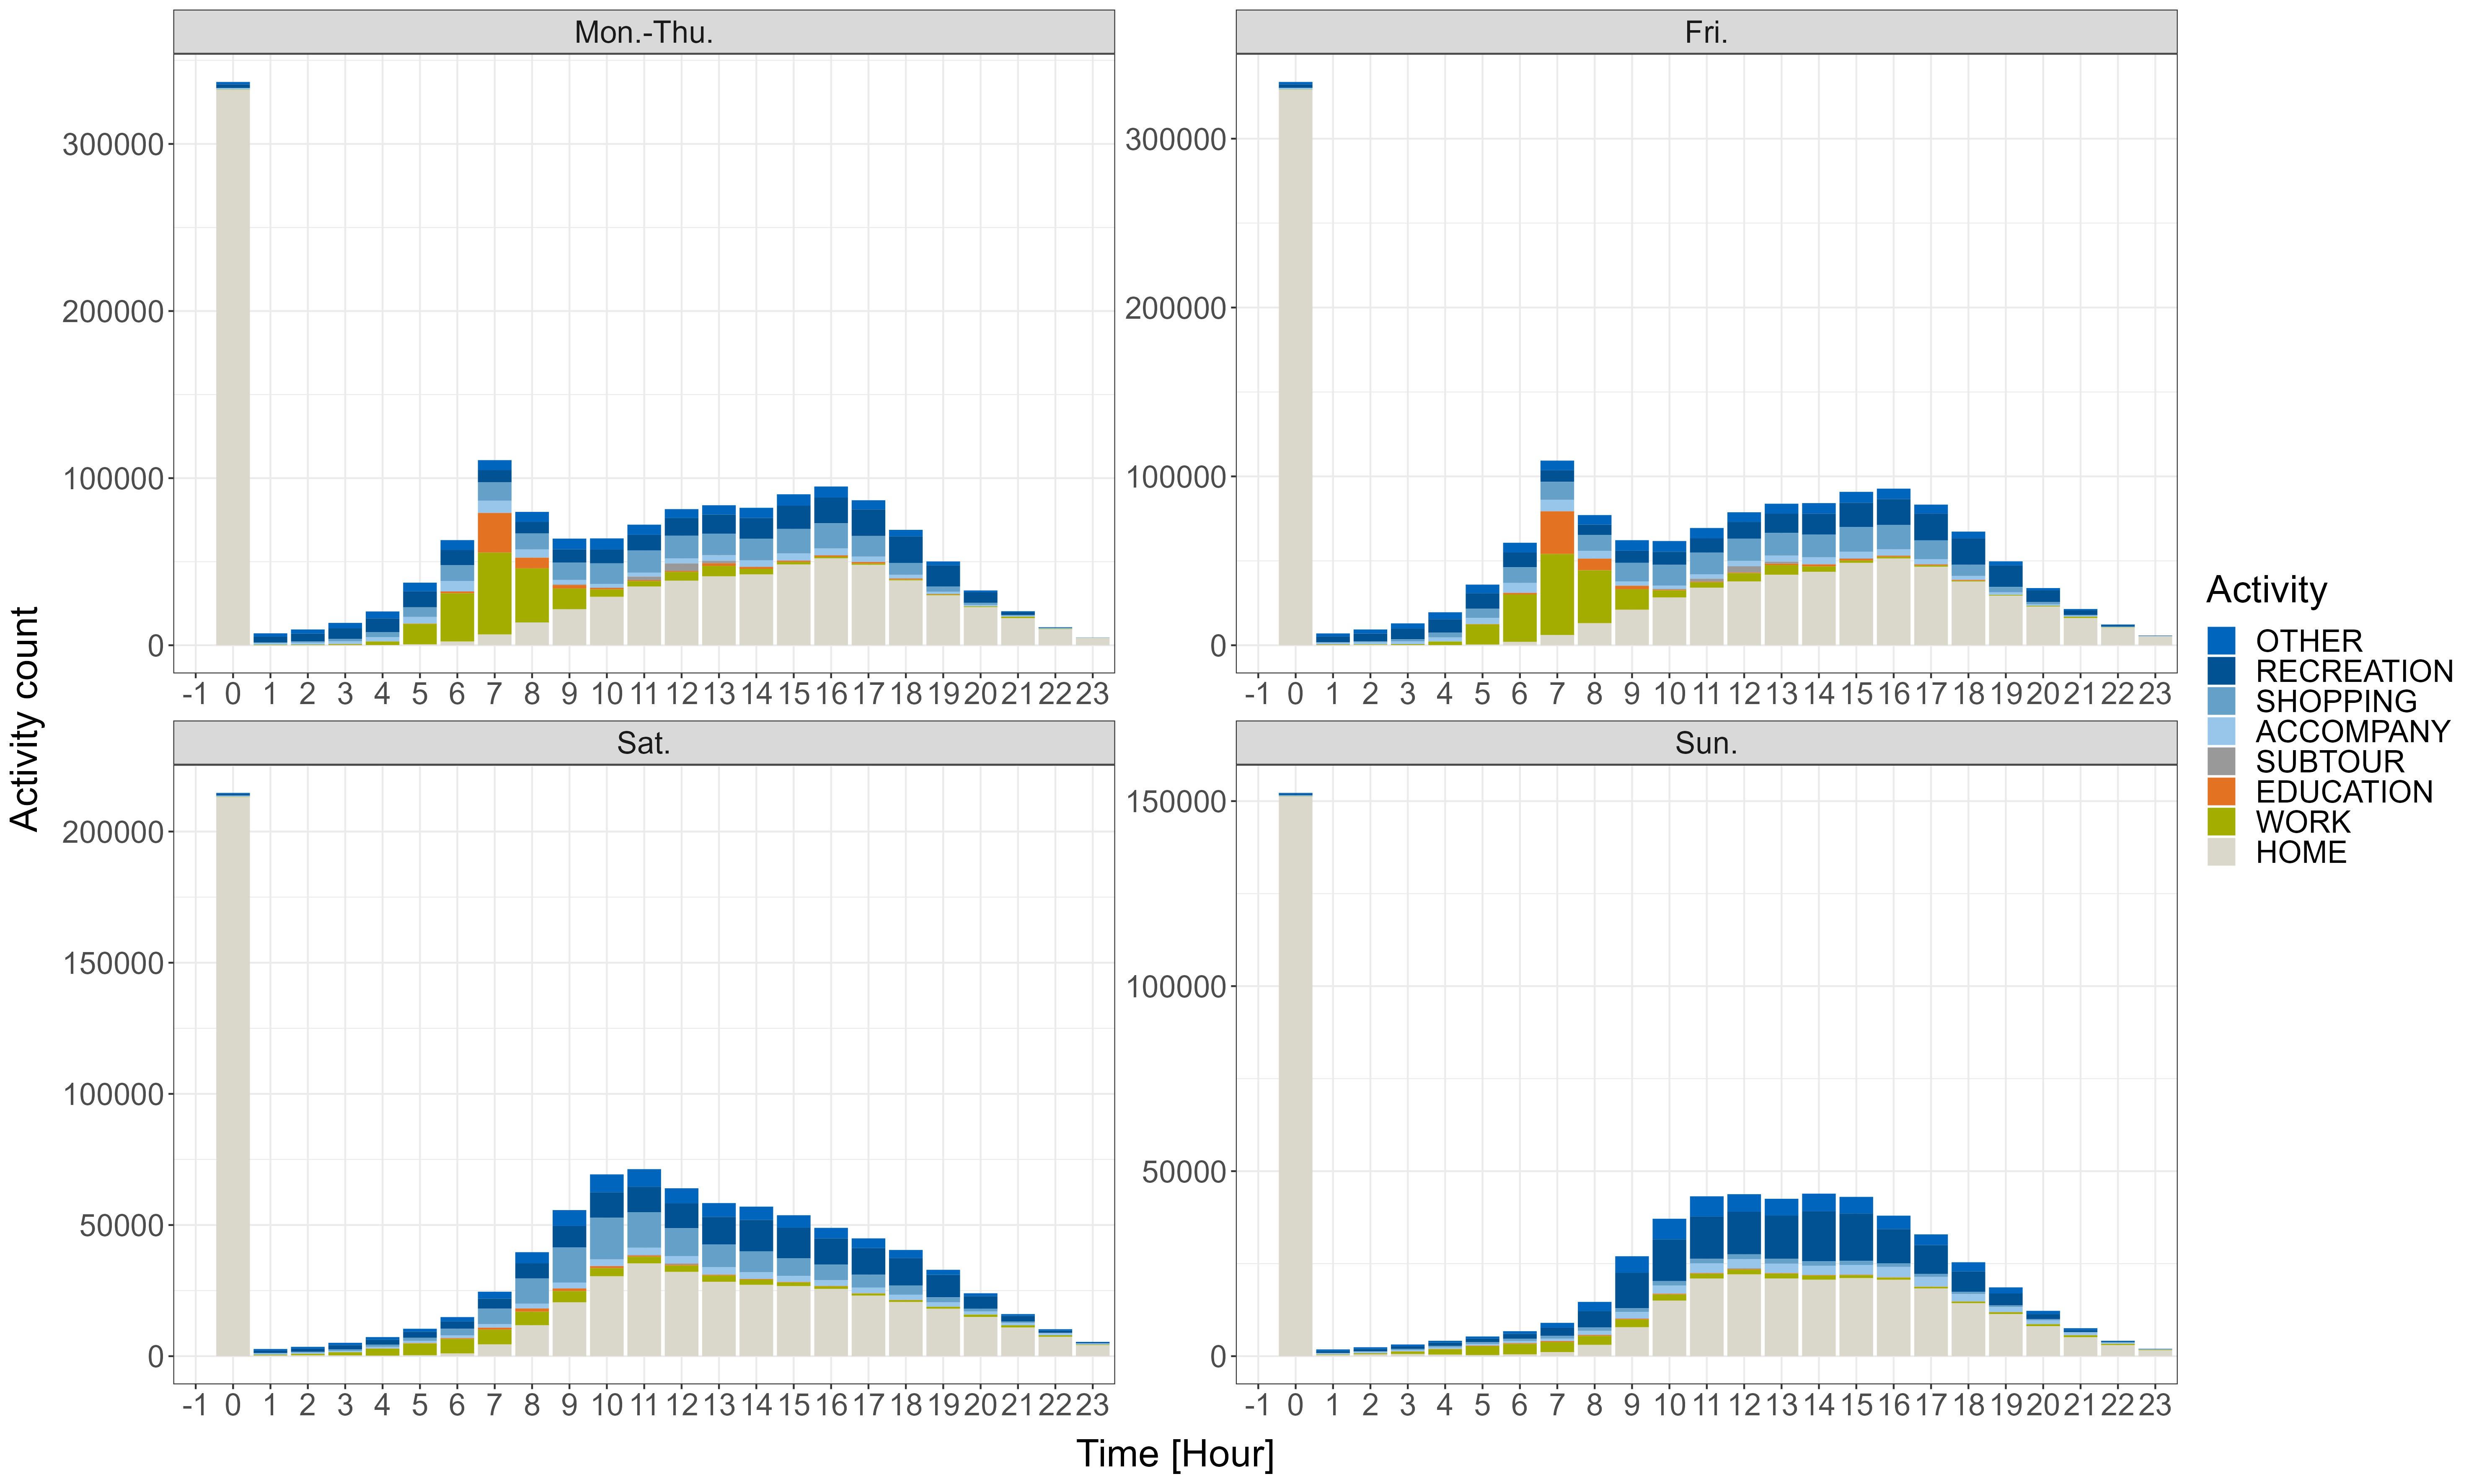
Distribution of activity start time
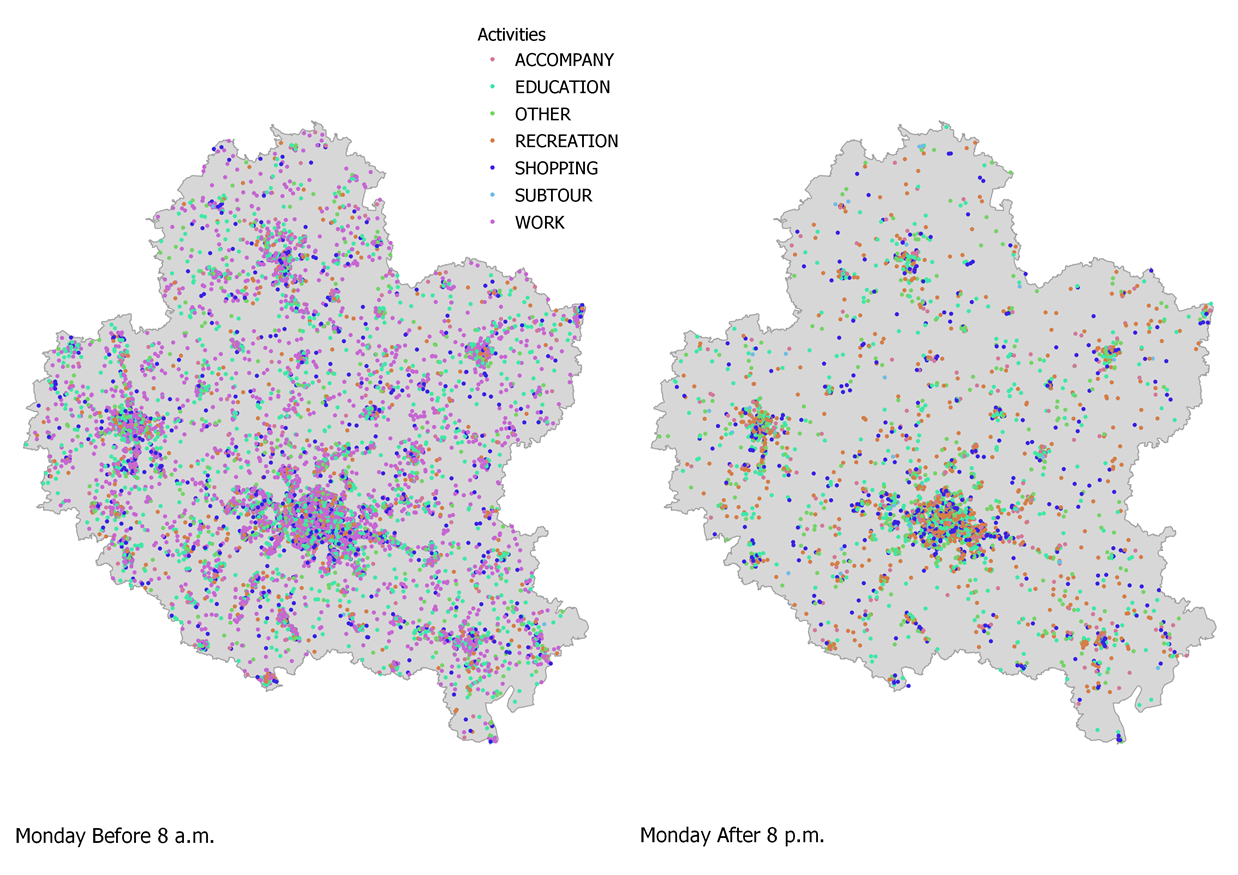
Spatial distribution of activity by activity start time
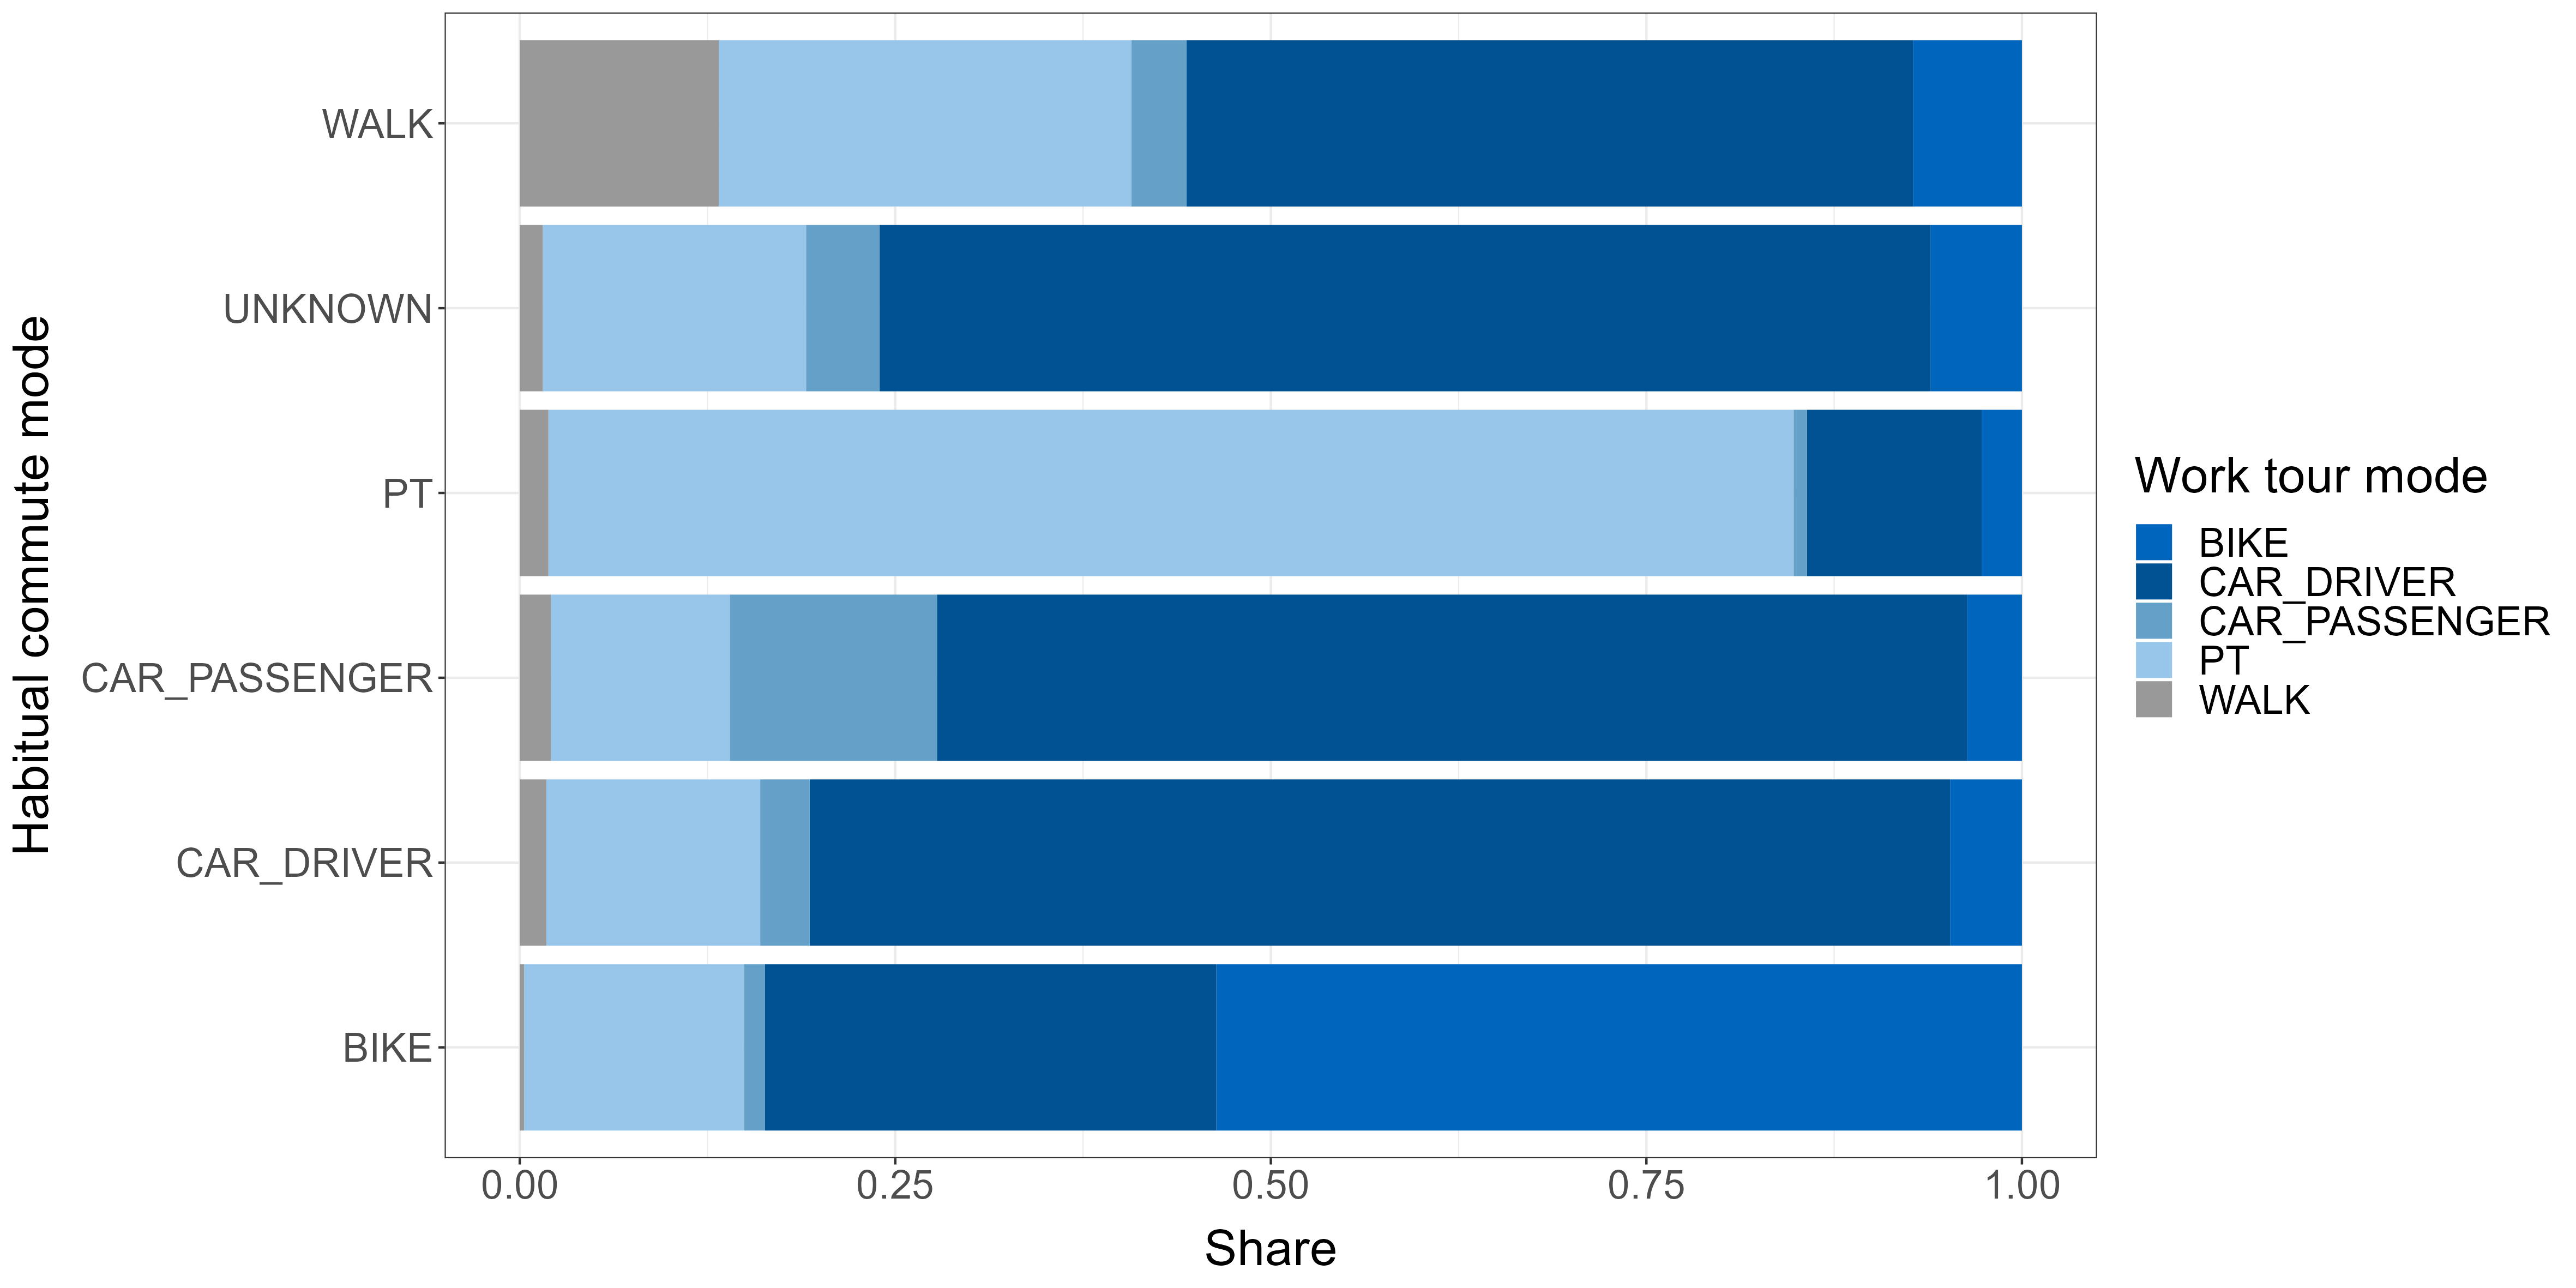
Habitual mode and work tour mode share
Use cases
A few scenarios have been tested using ABIT
- MCube DatSim: Low emission zone scenarios
- MCube AQT: Parking garage policy
ABIT produced outputs for other MCube clusters:
- SASIM
- MGeM
- COMFFICIENTSHARE
Publication
- The Activity-based model ABIT: Modeling 24 hours, 7 days a week. Transportation Research Procedia 78, 2024, 499-506 mehr… BibTeX Volltext ( DOI )