![]()
Laura-Kristin Scholtz, January 2016
The ultrasonic pulse-echo method, or pulse-echo method, is a non-destructive testing technique using ultrasonic waves to find defects in materials.
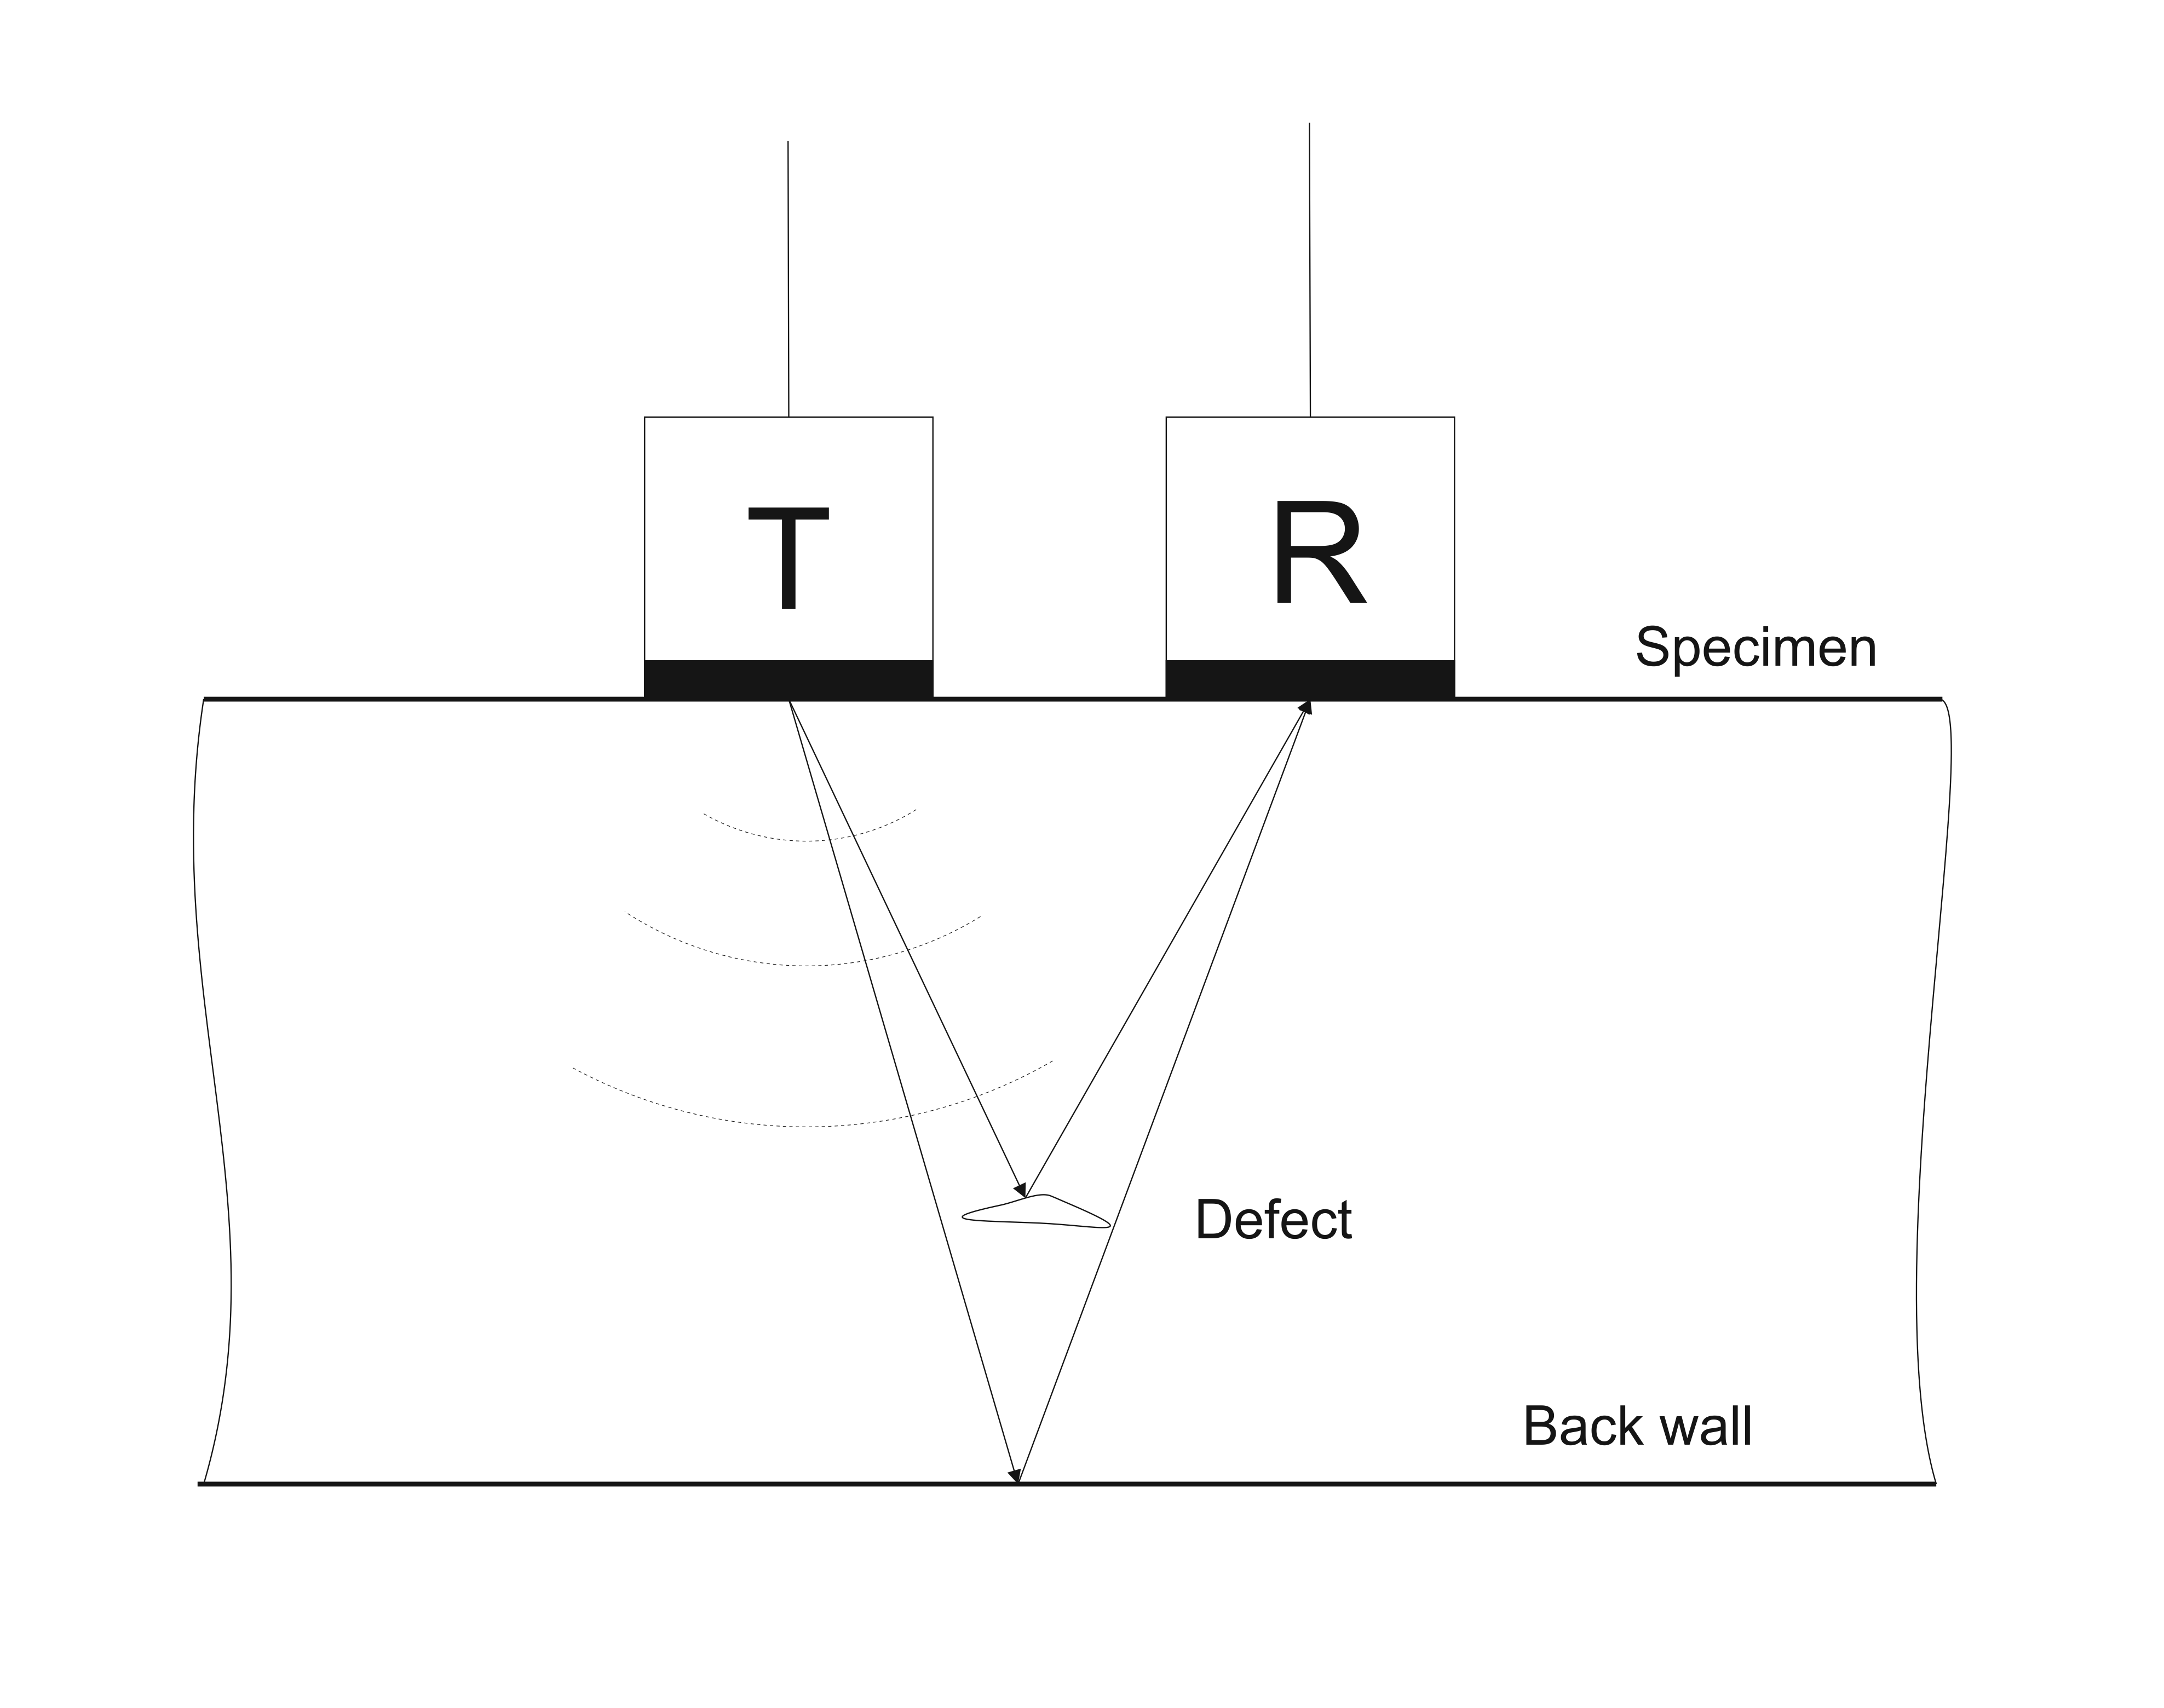
The principle of the pulse-echo method is shown in Figure 1. The transmitter (T) generates an ultrasonic pulsed wave which is reflected by an inhomogeneity like a defect or the back wall of the specimen, and obtained by the receiver (R). The received signal is displayed on a screen, see Figure 2. [1]
|
|
|---|---|
| Figure 1: Principle of ultrasonic pulse-echo method [1] [2] | Figure 2: Display of received signal [1] [2] |

Fundamentals
The pulse-echo method uses an ultrasonic pulsed wave (Ultraschall). Ultrasonic waves are mechanical vibrations and have a frequency greater than 20 000 Hz. Depending of the velocity of sound in a material and the frequency, the wavelength can be calculated:
\lambda = \frac{ c }{ f }
with
\lambda: wavelength [m],
c: velocity of sound [m/s] and
f: frequency [Hz].
An ultrasonic pulsed wave is a synthesis of sinusoidal waves with different frequencies and amplitudes. [2]
The ultrasonic pulse-echo method uses two types of waves, the longitudinal waves and the transverse waves (see Body and surface waves). In longitudinal waves the particle motion is in the same direction as the movement of the wave. If the particle movement is at a right angle to the direction of travel of the wave, it is called a transverse wave, which is only possible in solid materials. Longitudinal waves are always faster than transverse waves. The velocity of sound of both types of waves can be looked up for different materials. [2]
When an ultrasonic wave reaches a boundary between two media, one part of the energy is transmitted through the boundary and another part is reflected. The percentages of energy transmitted and reflected depend on the acoustic impedance:
Z = \rho \cdot c
with
Z: acoustic impedance [N \cdot s / m^3],
\rho: density of the material [kg/m^3] and
c: velocity of sound in the material [m/s].
Accordingly, whether a boundary can be seen or not with ultrasonic testing, depends on the difference of the acoustic impedance of the materials above and below the boundary. [3]
Set-up of ultrasonic equipment
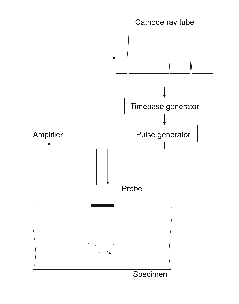
The set-up of an analog ultrasonic equipment can be seen in Figure 3. The pulse generator sends an electric pulse to the transmitter probe, which produces an ultrasonic pulse. This ultrasonic wave spreads into the specimen and is reflected to the receiver, which transforms the wave into an electric signal. This signal is then send to the amplifier and from there to the cathode ray (CR) tube, which displays the signal as peaks. The horizontal axis is proportional to the time t. The vertical axis shows the amplitude of the signal. The time base generator produces a high frequency wave and makes the spot move across the CR tube. [2]
The first peak on the display represents the generated ultrasonic pulse. The ultrasonic wave travels through the specimen until it is reflected or scattered by a surface. The reflected part of the wave can be seen as peak on CR tube. The other part of the wave continues to the back wall of the specimen and will be reflected there.
This type of analog set-up is obsolete. Modern set-ups are digital and don’t have a CR tube. An analog-to-digital (AD) converter is used between the set-up and the display. In modern displays the velocity of sound can be entered and the display shows the vertical distance of the peak instead of the time on the X axis. The depth of a defect or the back wall can be read directly from the display.
The display shows an apparently steady display. However if the specimen is 100 mm thick, the ultrasonic wave travels 200 mm, which takes in steel 33 μs. This wouldn't be possible to be seen on the display. Therefore the pulse has to be repeated many times per second. Typically, a pulse-repetition frequency PRF of 500-2000 pulses per second (pps) is used. [2]
Usually more echoes can be seen, which have the same distance as the peak from the back wall. Those echoes arise because of the effect that when the reflected wave reaches the test surface, only a part of the energy enters the receiver probe and the other part is reflected back to the back wall, where it is reflected again, see Figure 4. This can be seen until the amplitude is reduces to zero. [1]
The intensity of the ultrasonic wave is reduced while traveling through a material. This effect depends of the material and is based on various mechanisms, including scattering. Therefore the amplitudes of the peaks on the display decrease.

Types of display
There are different types of display for ultrasonic testing. The type so far described, which shows the time, representing the depth of the specimen, on the X-axis and the amplitude on the Y-axis, is called A-scan. It shows the raw signal at one position on the specimen and is the most widely used.
The B-scan shows a two-dimensional display with different bright fields. The brightness indicates the amplitude of the wave. To generate a B-scan the TR probe has to be moved over the surface of the specimen. The Y-axis shows the depth of the specimen and the X-axis the direction in which the probe is moved.
The C-scan also shows a two-dimensional display with different bright fields. The probe has to be moved over the specimen in a certain pattern. The display represents the specimen regarded from above. So that the X and the Y-axis on the display are the X and the Y-axis on the specimen. The brightness shows all echoes within a certain range of depth, usually between front and back echoes indicating defects. The information of the depth of the defect is lost. [1]
Transducers
Transducers, which are also called probes, are the transmitter and the receiver of an ultrasonic wave. With the piezo-electric effect the energy of an electric voltage is transformed into an ultrasonic wave. The receiver uses the inverse piezo-electric effect to transform the ultrasonic wave into an electric signal. [4]
The transmitter and the receiver can be two separate probes or one probe. Generally one probe is used which can transmit and receive the signal. If the probe has one crystal which serves as transmitter and immediately afterwards as receiver, it is a single-crystal probe. If there are two crystals, one to transmit and one to receive the ultrasonic wave, it is called twin-crystal or transmitter-receiver (TR) probe. Both types of probes can be vertical or angle probes (see also Ultraschallprüfköpfe).
Vertical and angle probes
Vertical probes transmit a longitudinal wave in perpendicular direction to the specimen. The receiver obtains the reflected longitudinal wave.
Angle probes have a wedge-shaped block between the crystal and the specimen, and transmit a longitudinal wave in an angle to the specimen. At the boarder to the specimen the wave is refracted into a longitudinal and a transverse wave. The angle of the longitudinal wave is larger than the angle of the transverse wave. The angle of the probe is selected so that only the transverse wave enters into the specimen. Standard angle probes are made for the angles 35°, 45°, 60°, 70° and 80° of the transverse wave for steel, which has a velocity of sound for the transverse wave of c_T = 3250 m/s. For other materials the angle of the transverse wave with these probes is different depending on the speed of sound. [4]
Delay line
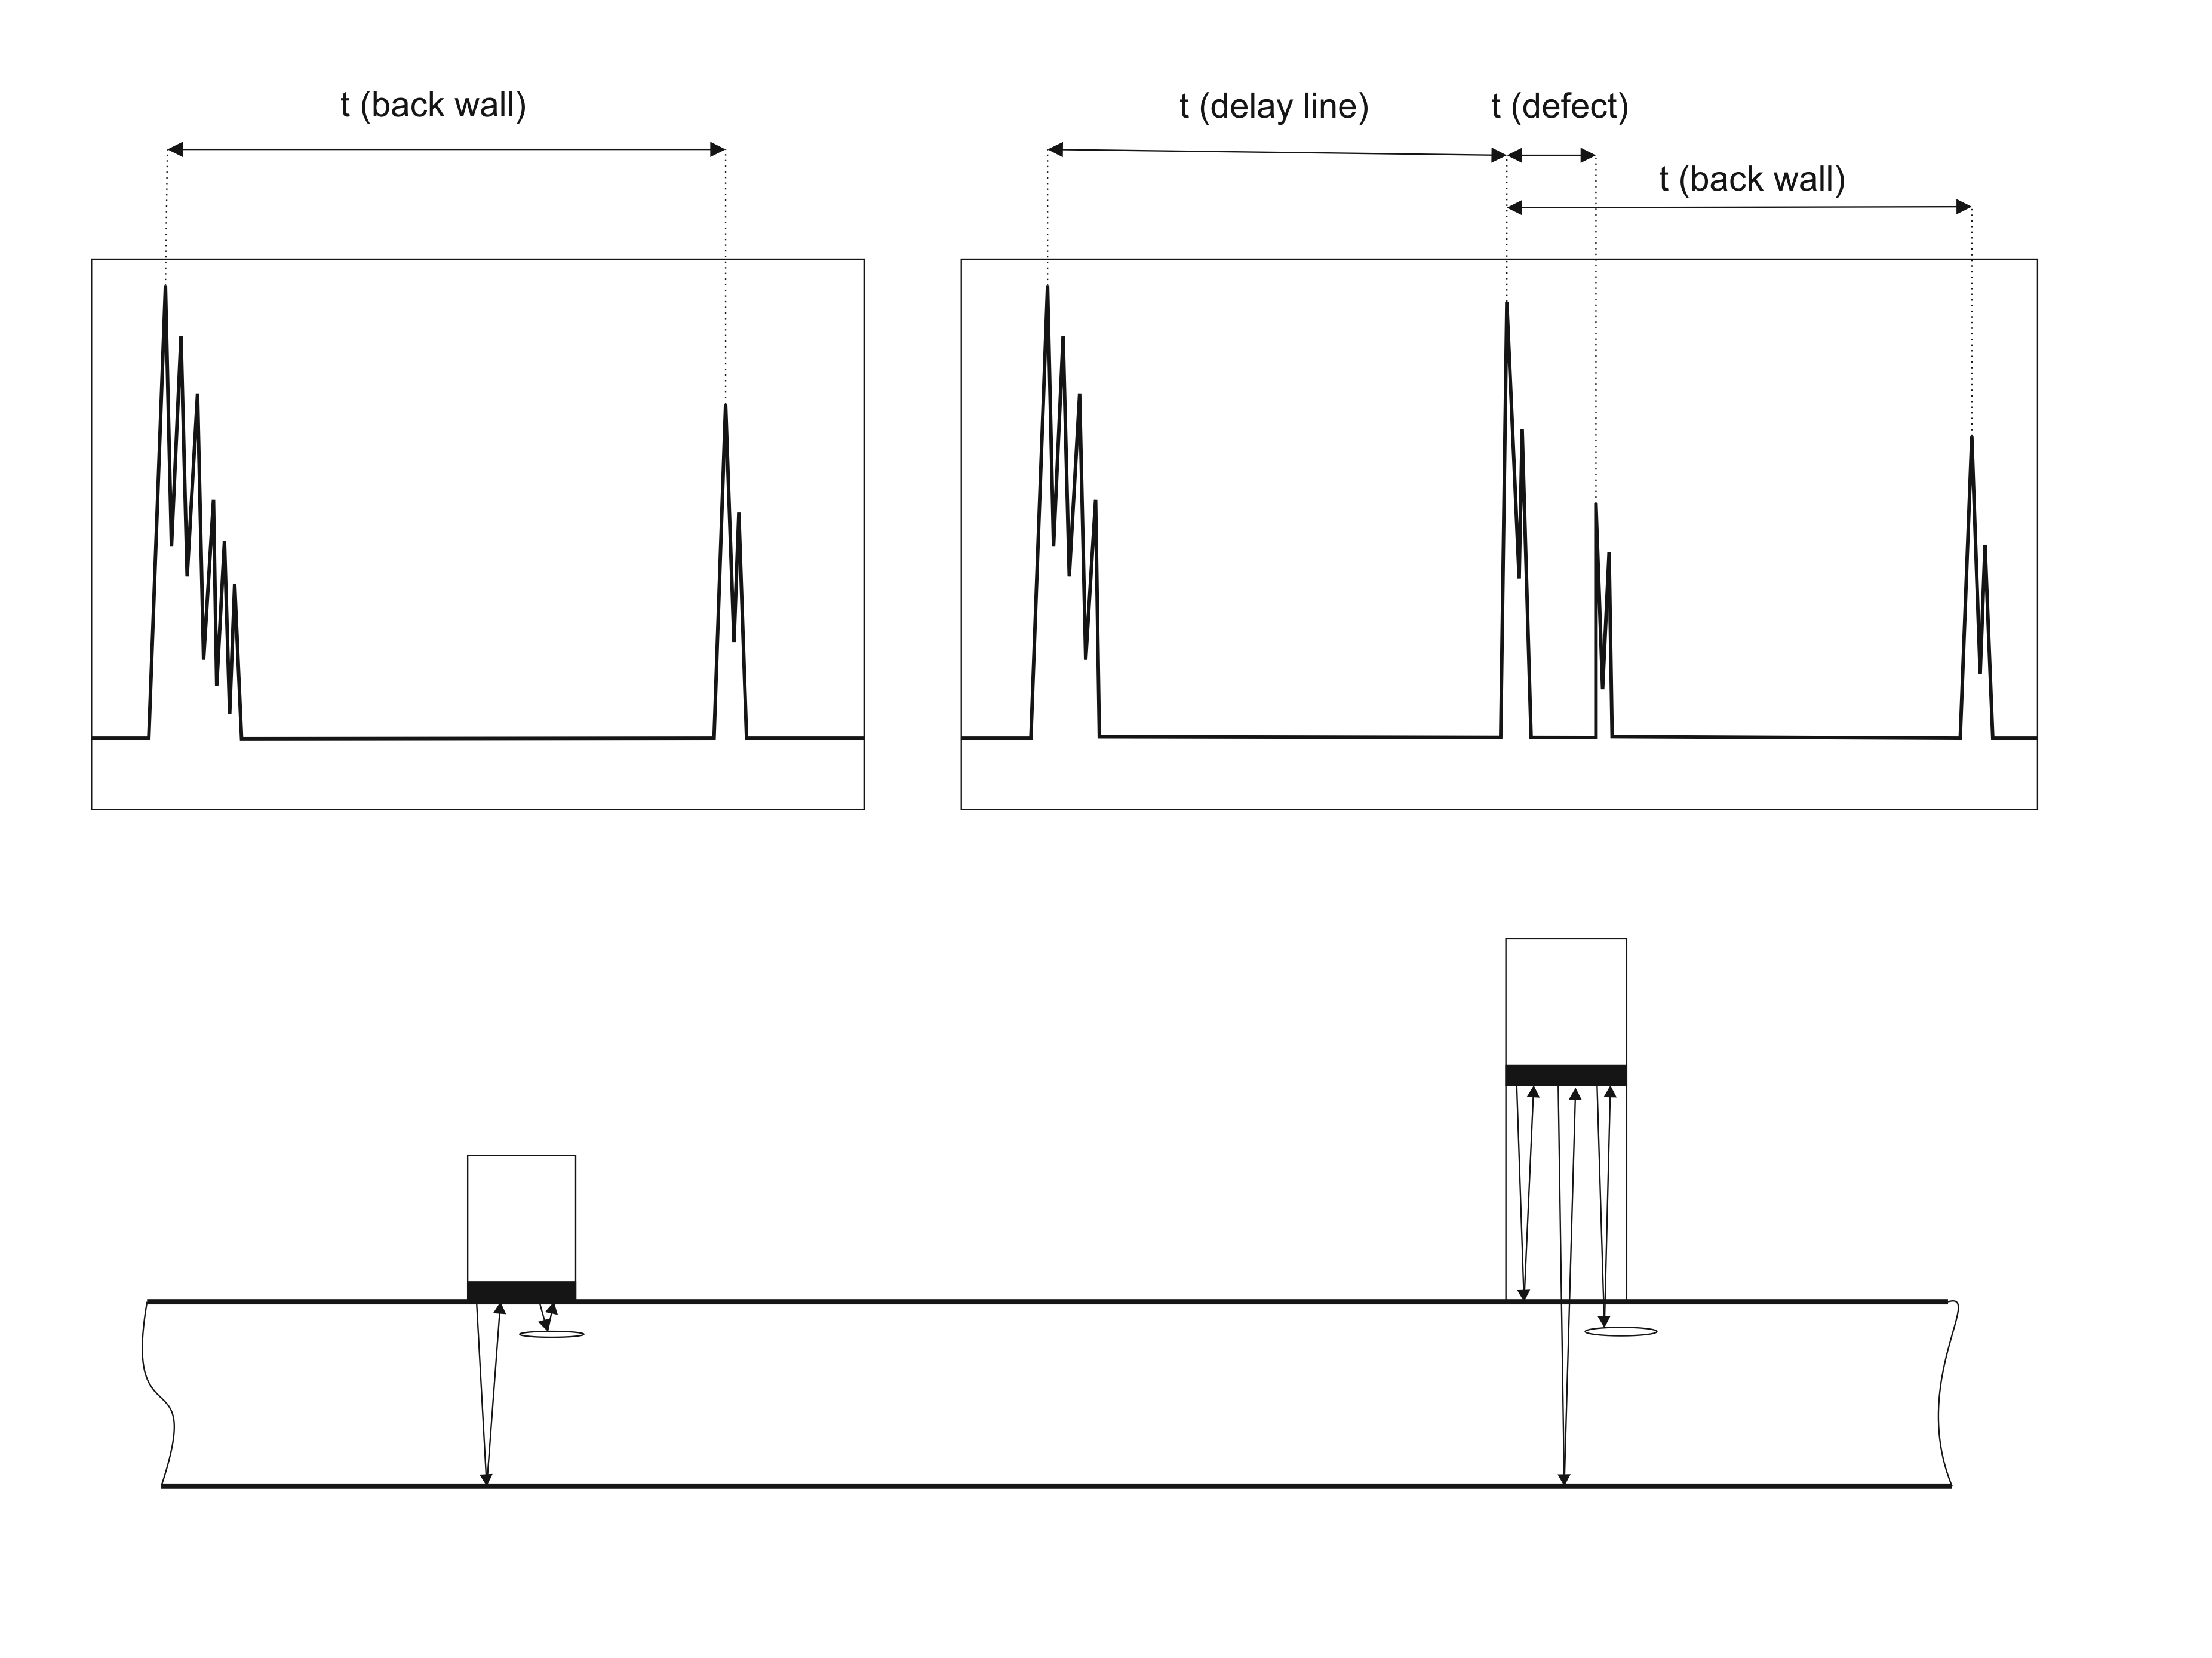
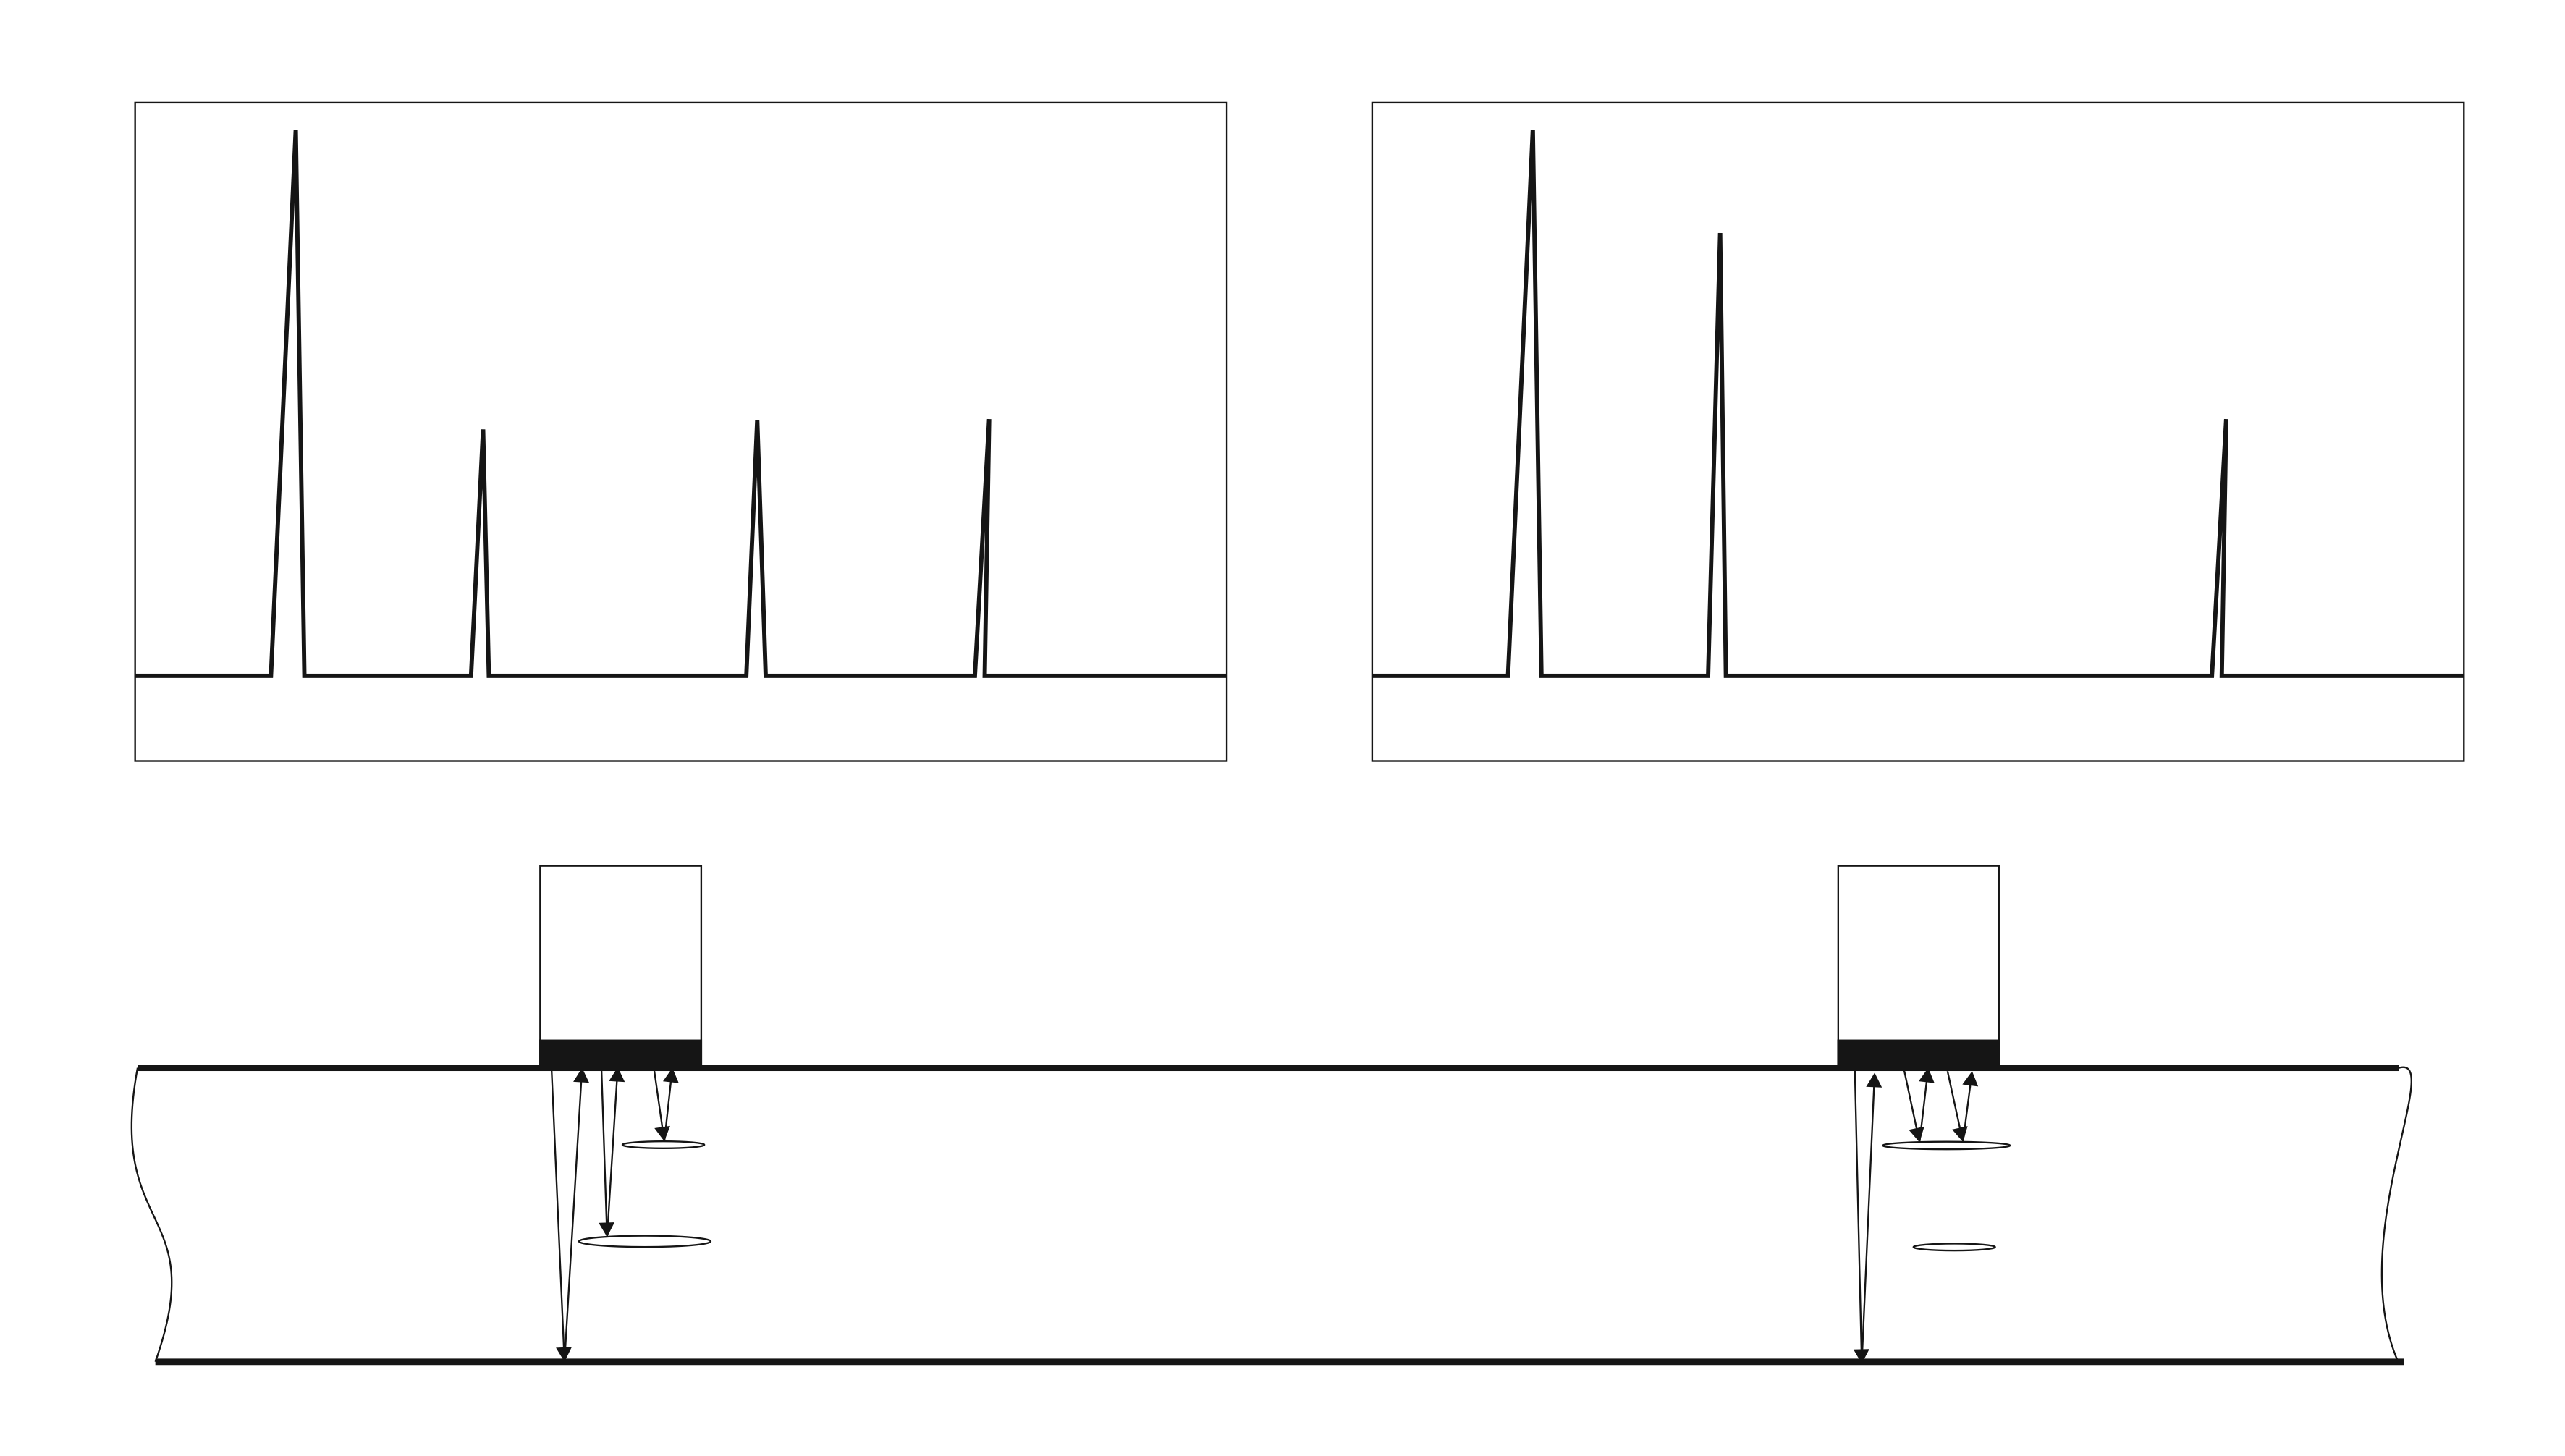
The ultrasonic wave received by the probe is not a single peak, instead it has a lot of noise. The transmitter pulse is followed by a dead-zone. This causes a bad resolution in the subsurface and defects in that area might not be seen. To avoid this problem delay lines are used between the transmitter and the specimen, see Figure 5. In the first case the specimen is tested with a normal probe. The defect in the subsurface can’t be detected. In the second case a probe with a delay line is used. The first peak is the transmitter pulse. The second peak is the signal of the wave reflected at the surface between the delay line and the specimen. The defect can be seen as third single peak. [1]
Transmitter-receiver probes always have a delay line. The two crystals are carefully shielded from each other acoustically and electrically. TR probes are used for thin specimens and for wall-thickness measurement. [5]
The delay line has to be more than twice the thickness of the specimen. If not, the wave which is reflected in the delay line, reaches the receiver before the wave which is reflected at the back wall of the specimen, and it is difficult to find the peak of the back wall.
Another use of delay lines is for testing of specimen at high temperature. Standard probes work between -20 °C and 60 °C. For applications with higher temperatures the delay lines are made of heat-resistant materials, like polyamide, sintered metal or quartz glass. [1]
|
|---|
| Figure 5: Ultrasonic testing without and with delay line |
Coupling
To maintain ultrasonic contact between the probe and the specimen, a couplant is used. If there is only a tiny gap of air, the ultrasonic waves are reflected completely. There are two types of coupling – dry coupling and coupling with a liquid.
The easiest way is coupling with water. This technique works well with composite materials. For materials that corrode at the contact with water, like metals, or change in another way, oil, grease, glycerin or other liquids have to be used. A good coupling liquid should have an acoustic impedance similar to the impedance of the test specimen, a high viscosity and should be non-corrosive, non-toxic and inexpensive. Glycerin has a high acoustic impedance, but is expensive. Medium viscosity oil is the most common coupling liquid, but it spreads a lot. [2]
For dry coupling a thin foil of rubber is used between the probe and the specimen. It is only applicable for smooth surfaces and frequencies under 1 MHz. The transfer of ultrasonic waves is not that good with dry coupling as with liquids. [3]
Testing with the ultrasonic pulse-echo method
Before testing with the ultrasonic pulse-echo method the set-up has to be chosen and some adjustments have to be made. Depending on what kind of properties and defects should be tested, the probe has to be selected. Depending on the material of the specimen, the type of coupling has to be chosen.
The display has to be adjusted. Depending on what is tested, on the X-axis the transmitter pulse should be seen on the left, the echo of the back wall on the right and defects in the middle. On the Y-axis the signal has to be amplified sufficient to see all defects.
The testing frequency which is used, depends on the material and on what kind of properties the specimen should be tested. The wavelength has to be smaller than the smallest defect which is wanted to be seen and bigger than inhomogeneities of the material. With the formula f = \frac{c }{\lambda} the frequency can be calculated. If the frequency is too large, the display shows a lot of noise and the echo of the back wall can’t be seen. For example in a fiber-reinforced composite material, the wavelength has to be larger than the diameter of the fiber. Generally forged and pressed metals are tested with frequencies between 2 and 6 MHz; cast materials with 0.5 to 2 MHz because they have a rougher structure. Ceramic materials have a good sound conductivity and can be tested with 4 MHz. The testing frequency for plastics is between 1 and 4 MHz, and for composites 5 MHz is used. Concrete and similar materials are tested between 20 and 200 kHz. [5]
Typical probe configurations
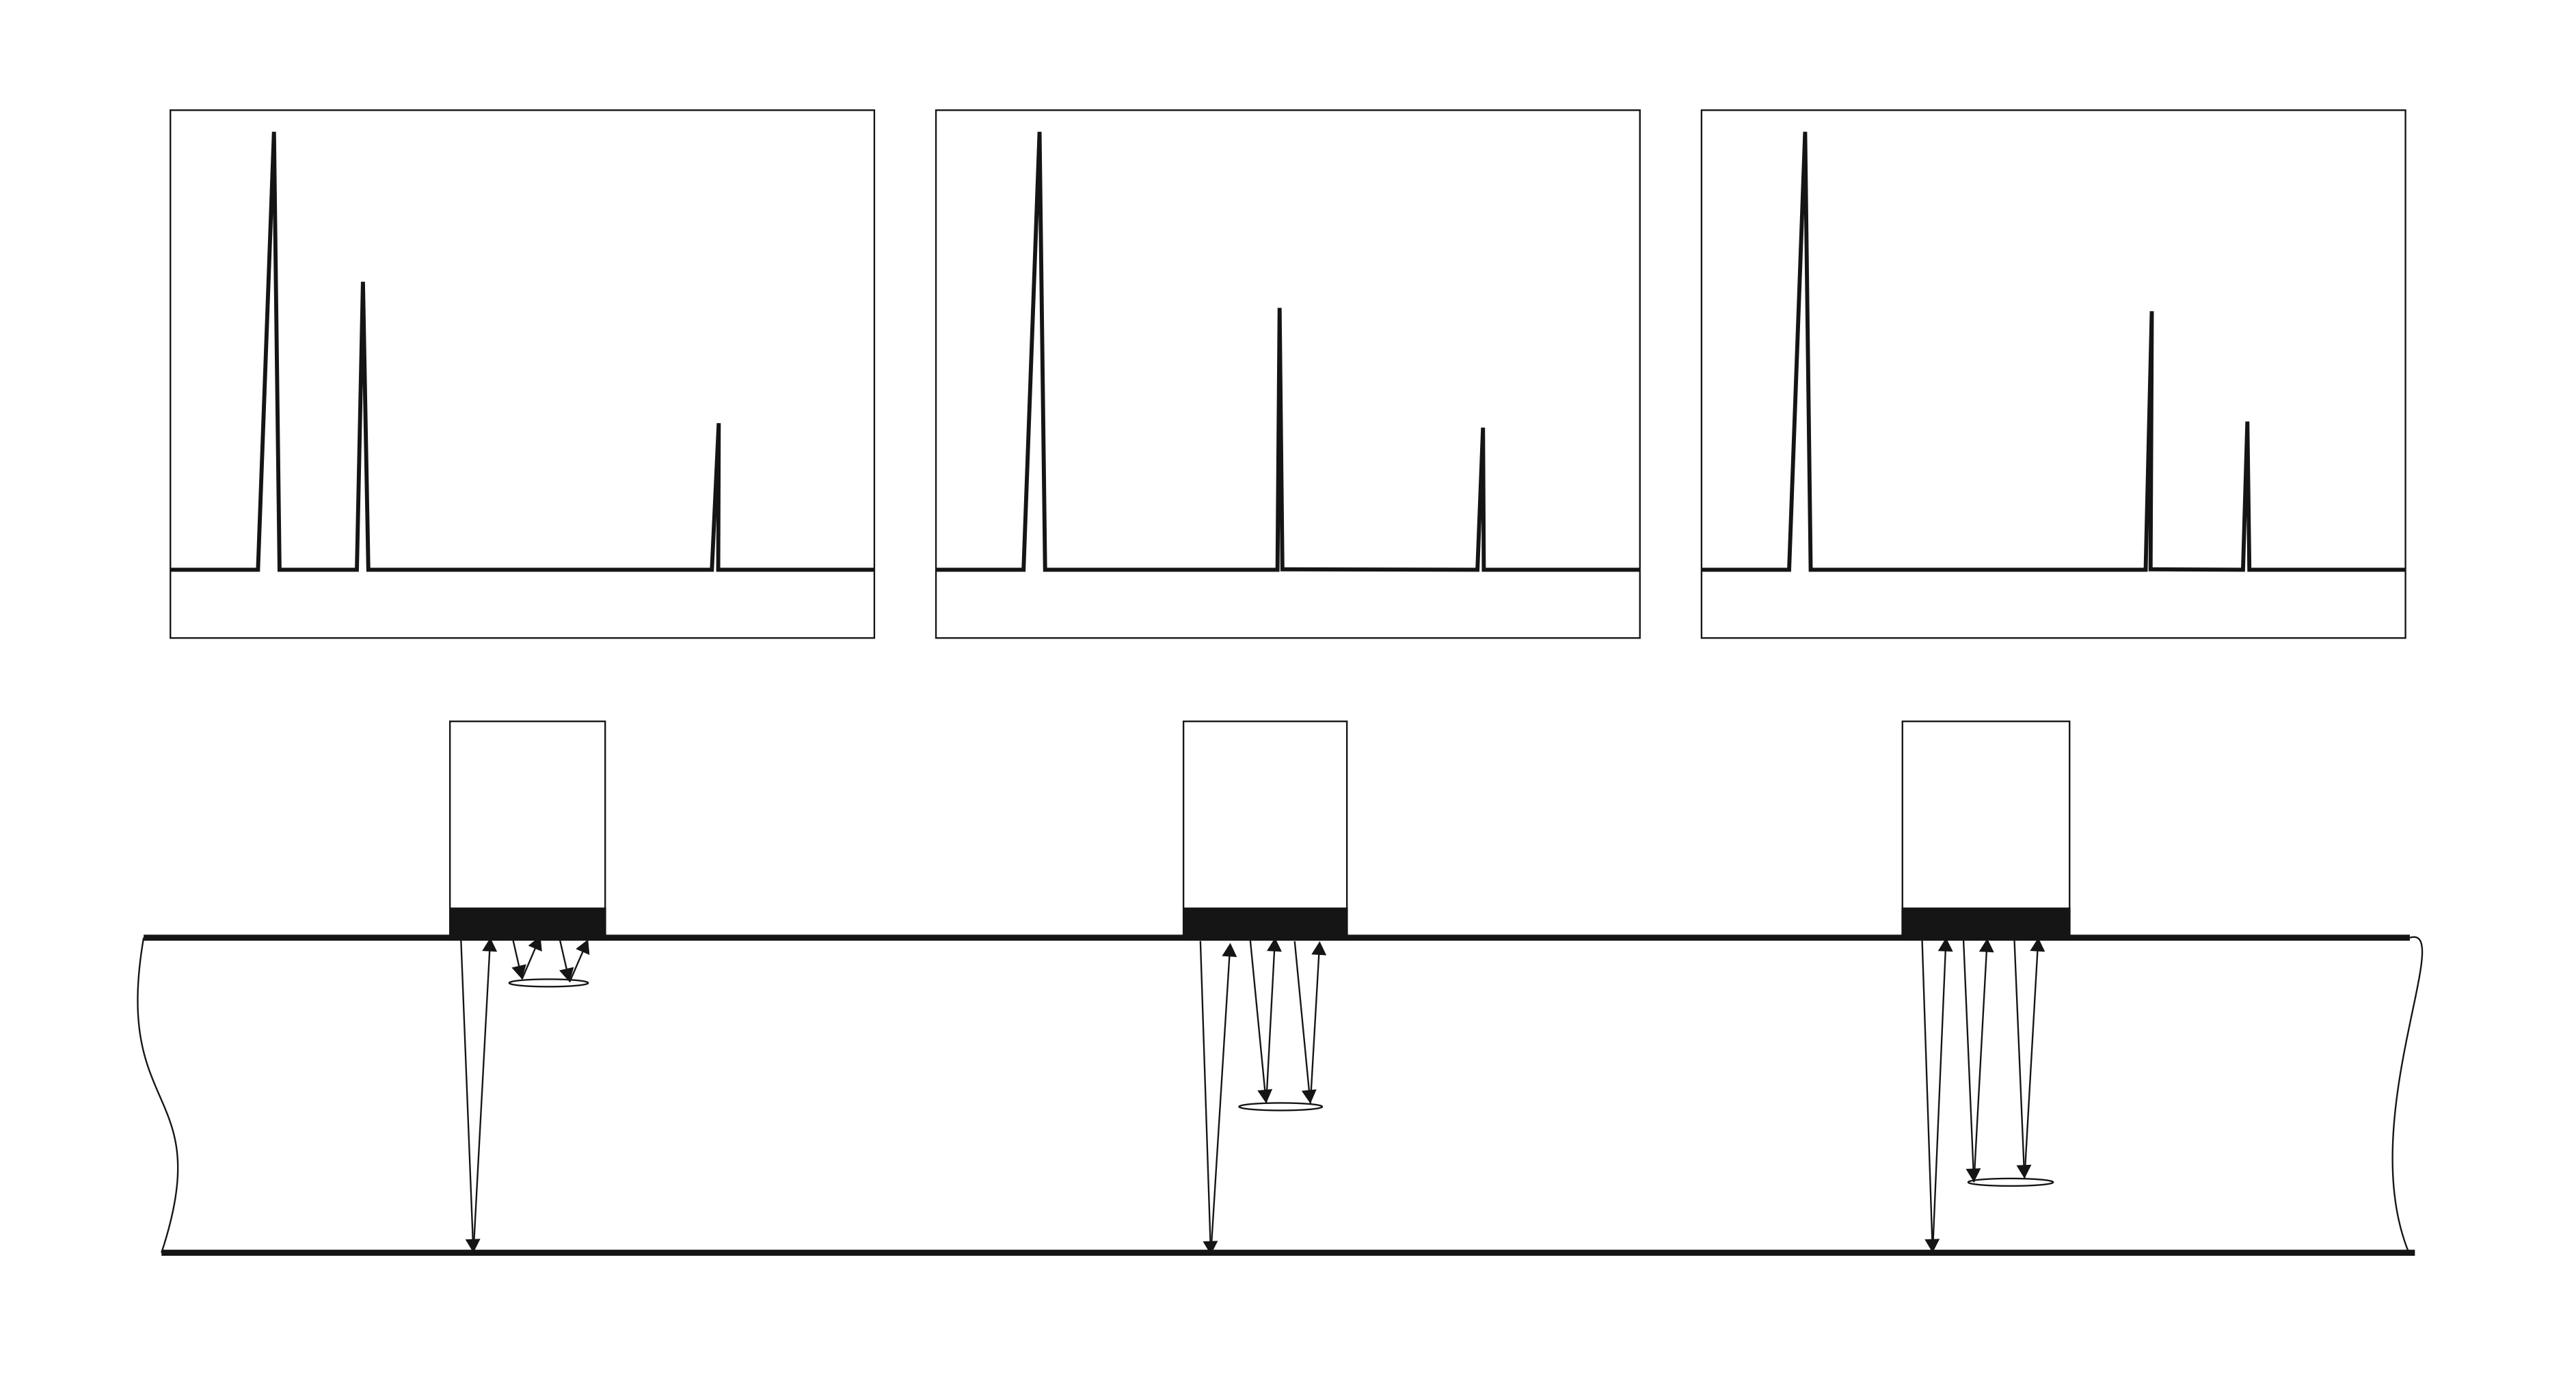
There are typical problems using the ultrasonic pulse-echo method. Figure 6 shows how a defect can be detected. In the first case there is no defect in the specimen. The display shows the peak of the transmitter pulse and the back wall echo. The probe is moved to the right and another peak appears on the screen. This is the pulse of the wave reflected at a defect in the material. The peak of the back wall echo is reduced to the peak in the first case, because part of the energy is reflected before reaching the back wall. The probe is moved further to the right. The amplitude of the peak of the defect increases and the one of the back wall decreases, until the peak of the back wall disappears. All the energy of the ultrasonic wave is reflected at the defect. This happens if the defect is very large. If a tester only sees the screen of the third case, he might think that it’s the echo of the back wall. To avoid this misinterpretation the probe should be moved around on the specimen.
Figure 7 shows how the position of the peak of the defect echo changes depending of the height of the defect in the specimen. The peak of a defect further up in the specimen is displayed further left on the screen. The wave needs less time to reach the defect and be reflected. On the screen the horizontal axis shows the time and therefore is proportional to the height in the specimen.
A problem which can appear in testing with the ultrasonic pulse-echo method is demonstrated in Figure 8. Two peaks which have the same horizontal position and different heights can’t always be detected separately. If the upper defect is smaller than the lower one, part of the energy of the wave reaches the lower defect and is reflected there. In the shown case also an echo from the back wall can be seen. If the upper defect is larger than the lower one, the wave doesn’t reach the lower defect. All of the energy in that direction is reflected. The lower defect is in the shadow of the upper one and can’t be detected. Usually this effect is no problem in ultrasonic testing as the specimen would already fail the test because of the big upper defect.
Another problem appears if the defect or the back wall is orientated oblique to the upper surface, as demonstrated in Figure 9. In the first case the defect can’t be seen on the display. Because of the oblique orientation of the defect, the wave is reflected away from the probe and no echo reaches the receiver. As part of the energy is reflected before reaching the back wall, the amplitude of the echo of the back wall decreases. The tester should see that and understand that there is something in the material that reflects part of the wave in a different direction. In the second case the back wall is orientated oblique. The peak of the back wall doesn’t appear on the screen. Part of the energy is reflected back to the receiver by a defect and can be seen as peak. If there is no defect in the material, no echo can be seen. Again the tester should see and understand the problem.
|
|
|
|
|---|---|---|---|
| Figure 6: Appearing defect in material [2] | Figure 7: Defects in different heights in material [5] | Figure 8: Two defects in different heights at the same horizontal position [1] | Figure 9: Oblique orientated defect and back wall [1] |


Measurement of specimen thickness
If the sonic velocity of the material is known, it is possible to measure the thickness of the specimen (Schichtdickenmessung mit Ultraschall). With the velocity of sound c and the time t between two peaks, the distance d in the material can be calculated:
d = \frac{c \cdot t}{2}.
As said before, modern digital displays show the depth of a peak by entering the velocity of sound. It is more accurate if more echoes of the back wall are used, as shown in Figure 4. The separation of n echoes is measured and divided by n.
If the velocity of sound is not known, but the thickness of the specimen is known, the velocity of sound can be calculated and the heights of defects can be estimated. For composite materials, a reference specimen with the same composition is made to calculate the velocity of sound before testing other specimens. [1]
Another way the measure the thickness of a specimen is using two or more receiver probes. The thickness can be calculated in the same way as it is done in the impact-echo method (see Impact-Echo).
Advantages and Disadvantages
Advantages [5] [3]
- Position and height of defect determinable
- Size of defect compared to reference object determinable
- Accessibility only on one side necessary
- Thickness of material measureable
- Large depth of penetration → thick-walled materials can be tested
- Cracks on surface determinable
- Almost all materials can be tested
- Automated testing possible
- Technique is fast, multifunctional and flexible
Disadvantages [5] [3]
- Adjustment of set-up and election of probe depending on testing problem
- Coupling necessary
- Only for specific error applicable
- Reference object necessary
- Type of error and direction has to be known
- Inspector has to be trained
- Result depends on experience
References
- Krautkrämer, J., Krautkrämer, H.: Ultrasonic Testing of Materials. 4th Fully Revised Edition. Springer-Verlag, Berlin (1990). Pages 167-221.
- Halmshaw, T.: Non-destructive Testing. Edward Arnold. London (1987). Pages 108-215.
- Deutsch, V., Platte, M., Vogt, M.: Ultraschallprüfung. Grundlagen und industrielle Anwendungen. Springer-Verlag, Berlin (1997).
- Deutsch, V., Vogt, M.: Ultraschallprüfung von Schweißverbindungen. DVS-Verlag, Düsseldorf (1995). Pages 4-41.
- Steeb, S. u.a.: Zerstörungsfreie Werkstück- und Werkstoffprüfung. Die gebräuchlichsten Verfahren im Überblick. Expert Verlag, Ehningen bei Böblingen (1993).
Literature
- Deutsch, V., Platte, M., Vogt, M.: Ultraschallprüfung. Grundlagen und industrielle Anwendungen. Springer-Verlag, Berlin (1997).
- Deutsch, V., Vogt, M.: Ultraschallprüfung von Schweißverbindungen. DVS-Verlag, Düsseldorf (1995).
- Halmshaw, T.: Non-destructive Testing. Edward Arnold. London (1987)
- Krautkrämer, J., Krautkrämer, H.: Ultrasonic Testing of Materials. 4th Fully Revised Edition. Springer-Verlag, Berlin (1990).
- Schiebold, K.: Zerstörungsfreie Werkstoffprüfung – Ultraschallprüfung. Springer-Verlag, Berlin (2015).
- Steeb, S. u.a.: Zerstörungsfreie Werkstück- und Werkstoffprüfung. Die gebräuchlichsten Verfahren im Überblick. Expert Verlag, Ehningen bei Böblingen (1993).
Überblick
Inhalte
Aufgabenbericht

![]() Der Inhalt ist verfügbar unter der Lizenz a Creative Commons Namensnennung-Nicht kommerziell 4.0 International Lizenz
Der Inhalt ist verfügbar unter der Lizenz a Creative Commons Namensnennung-Nicht kommerziell 4.0 International Lizenz![]() .
.