Introduction
Please switch to intel-toolkit 2025.2.0.
> module sw stack/24.5.0
> module load intel-toolkit/2025.2.0
We use the simple example also to be found in the book "Programming Your GPU with OpenMP: Performance Portability for GPUs" by Tom Deakin and Timothy G. Mattson.
It is intrinsic that this programming model is not really required to have communication between the GPUs. OpenMP intrinsically only allows this via the host (exchange of data via offload/backload). Therefore, this programming model is probably most useful if the work on the different GPUs is mostly independent of each other, but still comprises the same resource requirements (similar to what we know from job farming concepts). But otherwise, also different workflows could run on the different GPUs.
Still, OpenMP offers enough functionality to also allow cross-device communication. Look out for omp_target_memcpy and associated functions for device memory management.
To solve be the integral \pi = \int_0^1 \frac{4}{1+x^2}dx. As usual, we approximate the integral using a sum: \pi\approx\sum_{k=0}^N\frac{4\,\Delta x}{1+x_i^2}. Here, \Delta x = \frac{1}{N} is the step size. N such steps are contained in the interval [0,1] – the integration region. And x_i=(i+0.5)\,\Delta x the grid points in this interval.
Realization in C++
The source code may look as follows.
#include <omp.h>
#include <cassert>
#include <cmath>
#include <cstdio>

#include <iomanip>
#include <iostream>
#include <numeric>
#include <limits>

int main() {

// Get number of GPUs (devices)
  const int num_devices = omp_get_num_devices();
  assert(num_devices > 0) ;

  std::cout << " Found " << num_devices << " devices.\n";

  const unsigned long N = 100000000;
  assert(N % num_devices == 0) ;

  unsigned long len = N / num_devices;
  const double step = 1.0 / (double) N;

  double pi=0., time=0., mintime=std::numeric_limits<double>::max(), maxtime=0., time2=0.;

  auto total_time_start = omp_get_wtime();

// Create as many threads as available devices; num_threads should supersede OMP_NUM_THREADS
  #pragma omp parallel num_threads(num_devices) reduction(+:pi,time,time2) \
                                      reduction(min:mintime) reduction(max:maxtime)
  {

// double check: as many devices as there are threads
    #pragma omp single
    if(num_devices  != omp_get_num_threads()) exit(EXIT_FAILURE);

// Get thread ID to address the corresponding device
    int tid = omp_get_thread_num();

// Determine the loop start and end points
    int start = tid * len ;
    int end = start + len ;

    double sum = 0.;

    auto timestart = omp_get_wtime();

// target data and computation offload; mapping of variables
	#pragma omp target device(tid) map(tofrom:sum)
	{
// work-sharing loop on the GPU (including reduction)
      #pragma omp teams loop reduction(+:sum)
      for(int i = start; i < end; ++i) {
        double x = (i + 0.5) * step;
        sum += 4.0 / (1.0 + x*x);
      }
	}
    auto elapsed = (omp_get_wtime() - timestart);
    printf(" device %i : [%i,%i] : %g sec\n",tid,start,end,elapsed);
    time  += elapsed;
    time2 += elapsed*elapsed;
    mintime = std::min(mintime,elapsed);
    maxtime = std::max(maxtime,elapsed);
    pi += sum*step;
  }

  auto total_time_elapsed = omp_get_wtime() - total_time_start;

  std::cout << " elapsed time (device): " << time/(double)num_devices << " +/- "
            << std::sqrt((time2-time*time/(double)num_devices)/(double)num_devices) << " sec"
            << " ([min,max] = [" << mintime << "," << maxtime << "] sec)\n";
  std::cout << " elapsed time (total): " << total_time_elapsed << " sec\n";
  std::cout << "===========================================================================================================\n";
  std::cout << " result: pi = " << std::setprecision(16) << pi << '\n';
}
We create as many threads as there are devices (GPUs or tiles), one thread for each device. Each thread then creates a target offload context, which brings data and workload to the assigned GPU. The rest is just the steps of the integration algorithm, and some time measurement as instrumentation (performance measurement).
Compilation
For simple cases like this single-file application, compilation can be as simple as
> icpx -fiopenmp -fopenmp-targets=spir64 -o pi pi.cxx
or, for AOT (ahead-of-time) compilation of the offload kernels (the JIT (just-in-time) compilation overhead can be substantial - AOT compilation is worth considering),
> icpx -fiopenmp -fopenmp-targets=spir64_gen -Xs "-device pvc" -o pi pi.cxx
For larger projects, we recommend more automatic tools like make, cmake, scons, etc. For cmake, an example looks like that.
cmake_minimum_required (VERSION 3.20)
project (openmp-test LANGUAGES CXX VERSION 1.0.0)
set(CMAKE_CXX_FLAGS "-Wall")
set(CMAKE_CXX_STANDARD 20)
set(CMAKE_CXX_STANDARD_REQUIRED True)
set(CMAKE_CXX_EXTENSIONS False)

find_package(OpenMP 5.0 REQUIRED)

option(WITH_INTEL_PVC "OpenMP offload to Intel PVC GPU" ON)

if(WITH_INTEL_PVC)
  if(CMAKE_CXX_COMPILER_ID STREQUAL "IntelLLVM")
    SET(GPU_TARGET_FLAG -fopenmp-targets=spir64_gen -Xs "-device pvc")
  else()
    message(FATAL_ERROR "Not supported compiler!")
  endif()
else()
  message(FATAL_ERROR "No chance without GPU support!")
endif()

add_executable( pi pi.cxx )
target_compile_options( pi PRIVATE "${GPU_TARGET_FLAG}" )
target_link_options( pi PRIVATE "${GPU_TARGET_FLAG}" )
target_link_libraries( pi PUBLIC OpenMP::OpenMP_CXX )
With some cmake module loaded (additionally), having pi.cxx and CMakeLists.txt having in the same source directory (source_dir), configuring and building the executable goes like that.
> cmake -S source_dir -B build
> cmake --build build
The executable is the in build.
Test Run
Executing the pi executable might result in something like this.
> ./pi # or, ./build/pi for the cmake example
 Found 8 devices.
 device 5 : [62500000,75000000] : 0.0289481 sec
 device 0 : [0,12500000] : 0.0458739 sec
 device 2 : [25000000,37500000] : 0.0674229 sec
 device 4 : [50000000,62500000] : 0.0851879 sec
 device 1 : [12500000,25000000] : 0.101697 sec
 device 6 : [75000000,87500000] : 0.122331 sec
 device 7 : [87500000,100000000] : 0.139883 sec
 device 3 : [37500000,50000000] : 0.156617 sec
 elapsed time (device): 0.0934951 +/- 0.0421572 sec ([min,max] = [0.0289481,0.156617] sec)
 elapsed time (total): 0.157467 sec
===========================================================================================================
 result: pi = 3.141592653589793
Next to instrumentation, there are other means to investigate the applications time consumption.
Using LIBOMPTARGET_PLUGIN_PROFILE=T for profiling, for instance, gives some output similar to the following for each GPU.
======================================================================================================================
LIBOMPTARGET_PLUGIN_PROFILE(LEVEL_ZERO) for OMP DEVICE(5) Intel(R) Data Center GPU Max 1550, Thread 13
----------------------------------------------------------------------------------------------------------------------
Kernel 0                  : __omp_offloading_43_ab93a68__Z4main_l43
----------------------------------------------------------------------------------------------------------------------
                          : Host Time (msec)                        Device Time (msec)
Name                      :      Total   Average       Min       Max     Total   Average       Min       Max     Count
----------------------------------------------------------------------------------------------------------------------
Compiling                 :      19.53     19.53     19.53     19.53      0.00      0.00      0.00      0.00      1.00
DataAlloc                 :       0.46      0.04      0.00      0.11      0.00      0.00      0.00      0.00     12.00
DataRead (Device to Host) :       1.94      1.94      1.94      1.94      0.00      0.00      0.00      0.00      1.00
DataWrite (Host to Device):       0.28      0.14      0.01      0.27      0.00      0.00      0.00      0.00      2.00
Kernel 0                  :       3.26      3.26      3.26      3.26      0.06      0.06      0.06      0.06      1.00
Linking                   :       0.00      0.00      0.00      0.00      0.00      0.00      0.00      0.00      1.00
OffloadEntriesInit        :       2.92      2.92      2.92      2.92      0.00      0.00      0.00      0.00      1.00
======================================================================================================================
The overhead of the offload is quite substantial in this case. This very simple application does not expose enough workload on the GPUs. You can remove the teams specifier in the work-sharing loop pragma. Then the GPU time substantially increases. That's because we essentially dispense with parallelism on the GPUs then, i..e. the loop essentially runs serially.
For further tools, e.g. analysing the respective device occupation, look for "oneAPI Debug Tools for SYCL* and OpenMP* Development" on Intel's documentation. One tool is APS (Intel's "Advanced Performance Snapshot"). aps is contained in the vtune module. So, please load
> module load intel-oneapi-vtune/2024.2.1
and run your application with aps on a compute node (on login nodes, the necessary previliges are not sufficiant).
> aps ./main
> aps --report aps_result_<timestamp>
The result is (next to some print-out to stdout) a HTML page which can be viewed in a browser. For our example, the result looks like follows.
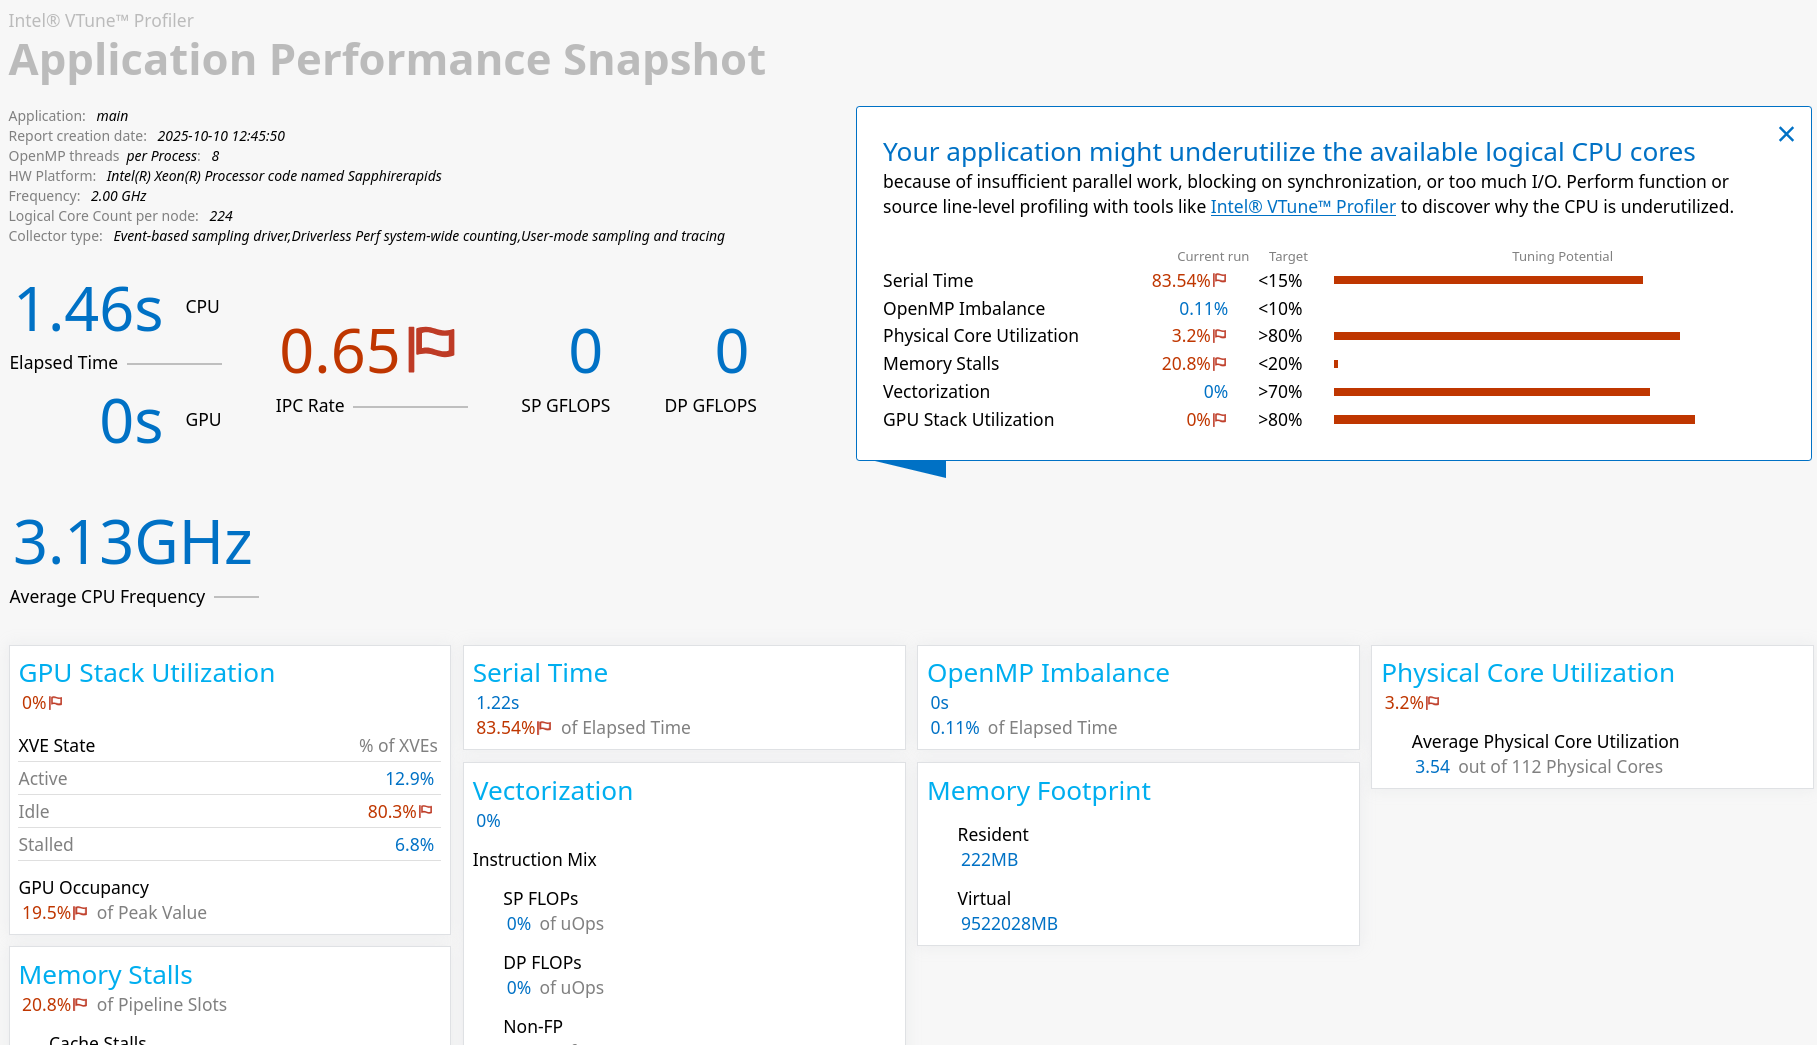
CPU (host) and GPU (devices) utilization is shown together with several other metrics from which you can assess the efficiency of your application. The small window in the top right corner tells the most severe short-comings, together with recommendations of how to scrutinize these bottlenecks next (this case is simple - we do not have enough workload at all).
The next step is usually to use vtune or some other of the tools of Intel's performance tools suite.
Currently (Oct 2025), the default is to expose the tiles of the GPUs to the user. Therefore, there are 8 devices per node (4 GPUs with 2 tiles per GPU). This is for performance reasons. Of your application can better benefit from using GPUs as a whole device (also e.g. for memory reasons), environment variables can be used to accomplish that.
> ZE_FLAT_DEVICE_HIERARCHY=COMPOSITE ./pi
 Found 4 devices.
 device 0 : [0,25000000] : 0.0252209 sec
 device 3 : [75000000,100000000] : 0.043608 sec
 device 1 : [25000000,50000000] : 0.0645211 sec
 device 2 : [50000000,75000000] : 0.0818782 sec
 elapsed time (device): 0.053807 +/- 0.021354 sec ([min,max] = [0.0252209,0.0818782] sec)
 elapsed time (total): 0.0824831 sec
===========================================================================================================
 result: pi = 3.141592653589793
4 devices are recognized now. It is indeed faster. But probably, it is the overhead governing the timing here.
We can recommend some literature:
T. Deakin, T. G. Mattson: "Programming Your GPU with OpenMP: Performance Portability for GPUs" (2023)
T. Mattson, Y. He, A. E. Koniges: "The OpenMP Common Core: Making OpenMP Simple Again" (2019)
R. v. d. Pas, E. Stotzer, C. Terboven: "Using OpenMP-The Next Step: Affinity, Accelerators, Tasking, and SIMD" (2017)
OpenMP Reference Guides


