HPC Report
General
The HPC Report shows aggregated performance information about your submitted jobs on the nodes of SuperMUC-NG. The report is based on the PerSyst and DCDB Tool which collects performance properties of all running jobs every 2 minutes. No instrumentation is needed nor modifications to the user codes.
The report includes a timeline view with the severity distribution over the affected CPUs (or other domains such as nodes) and a data/performance view with comparison graphs between properties.
The web API is accessible with a valid LRZ SuperMUC user account (LDAP-SIM; VPN is not required). Note that you can only view your jobs and not other users' jobs. The master user can access the jobs of the users in her/his project.
Click on the button "Search Job Ids" if you know your Slurm job Ids to search or in click on the "Filtered Search"-Button if you would like to set filtering options to search for your jobs. Jobs which haven't finished and have not yet been included in the budgeting will only show if you search them via "Search Job Ids" and have performance data available. Otherwise you will have to wait one more day after they are completed to see them in the Accounting Table.
Please note that requesting large amounts of information may take a long time. We have no way around this problem, your only protection against long waiting times is to limit the number of jobs on the input mask. More specifically putting a limit in the "Max number of jobs" field. We recomend a maximum of 20 jobs when you will like to request performance data. If you choose to request accounting data only, you may increase this limit to 15000 jobs which should be more than enough for most projects to check all your data.
For more information about the different output views of the web API please go to the explanation on the Accounting Only View, Jobs View, Timeline View, and Data/Performance View. You can see how to switch off our performance measurements to perform your own measurements here.
Jobs View
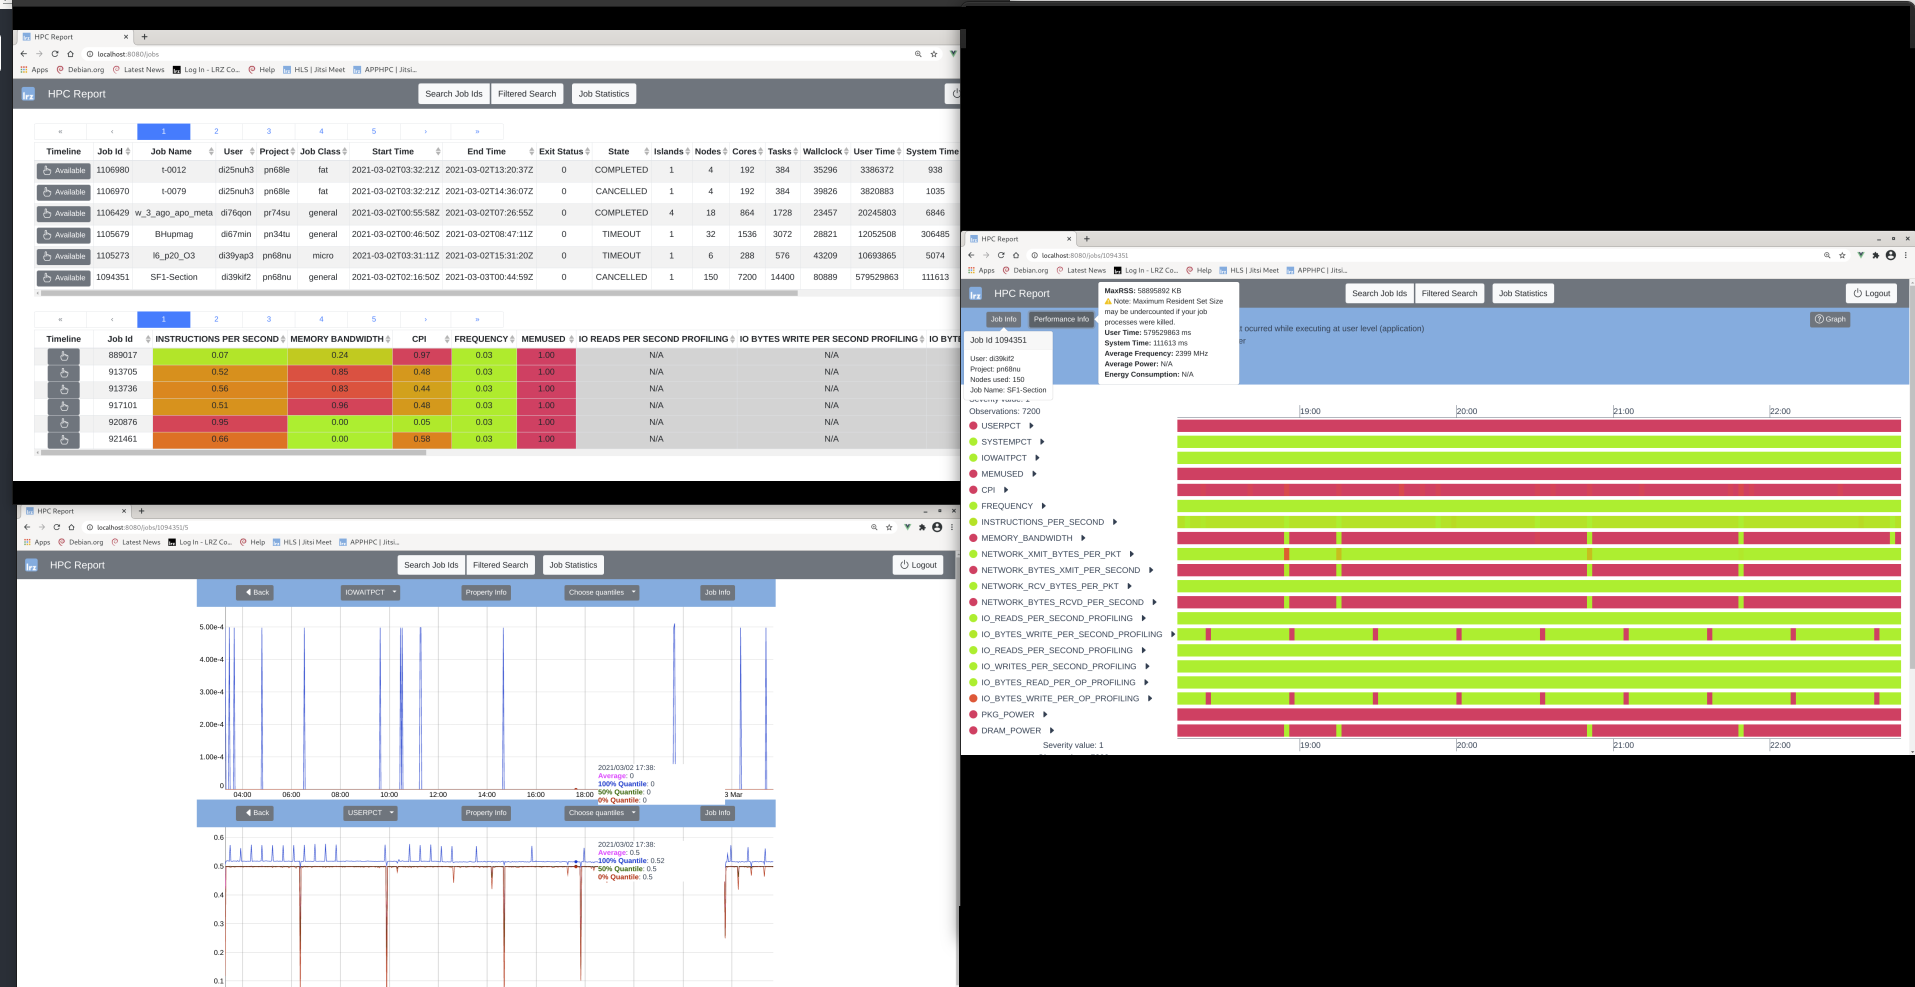
This view includes two tables in the top the Accounting table and in the bottom the Performance Average table:
Accounting Table
Initially, a list of jobs (accounting information) is shown in the top of the Performance Average table which matches the parameters passed to the tool that generates this report. The buttons on the upper right give information about the user and the project details.
- The table is sortable by clicking the column headers.
- Click on the Timeline column to go to the Timeline View for the corresponding job. Note that jobs with no performance data will have this button disabled.
- By clicking on one job in the Jobs View, the corresponding job will be marked blue on the Performance Average Table.
Performance Average Table
The header of the performance average table shows the metrics, which we will call properties hereafter. The table shows a job per row and the average severity of its collected properties. The severity ranges from 0 to 1, and the averaged value is shown on the table cell. The performance is considered "good" when the severity is 0 or "bad" when the severity is 1 and is coded in color from green to red respectively. Note that this classification is only a hint that optimization is needed. Depending on what the job does, it might not be possible to optimize the job.
Grey table cells are properties which were not collected for your job. The Timeline column has buttons to go to the individual Timeline View of each job.
Timeline View
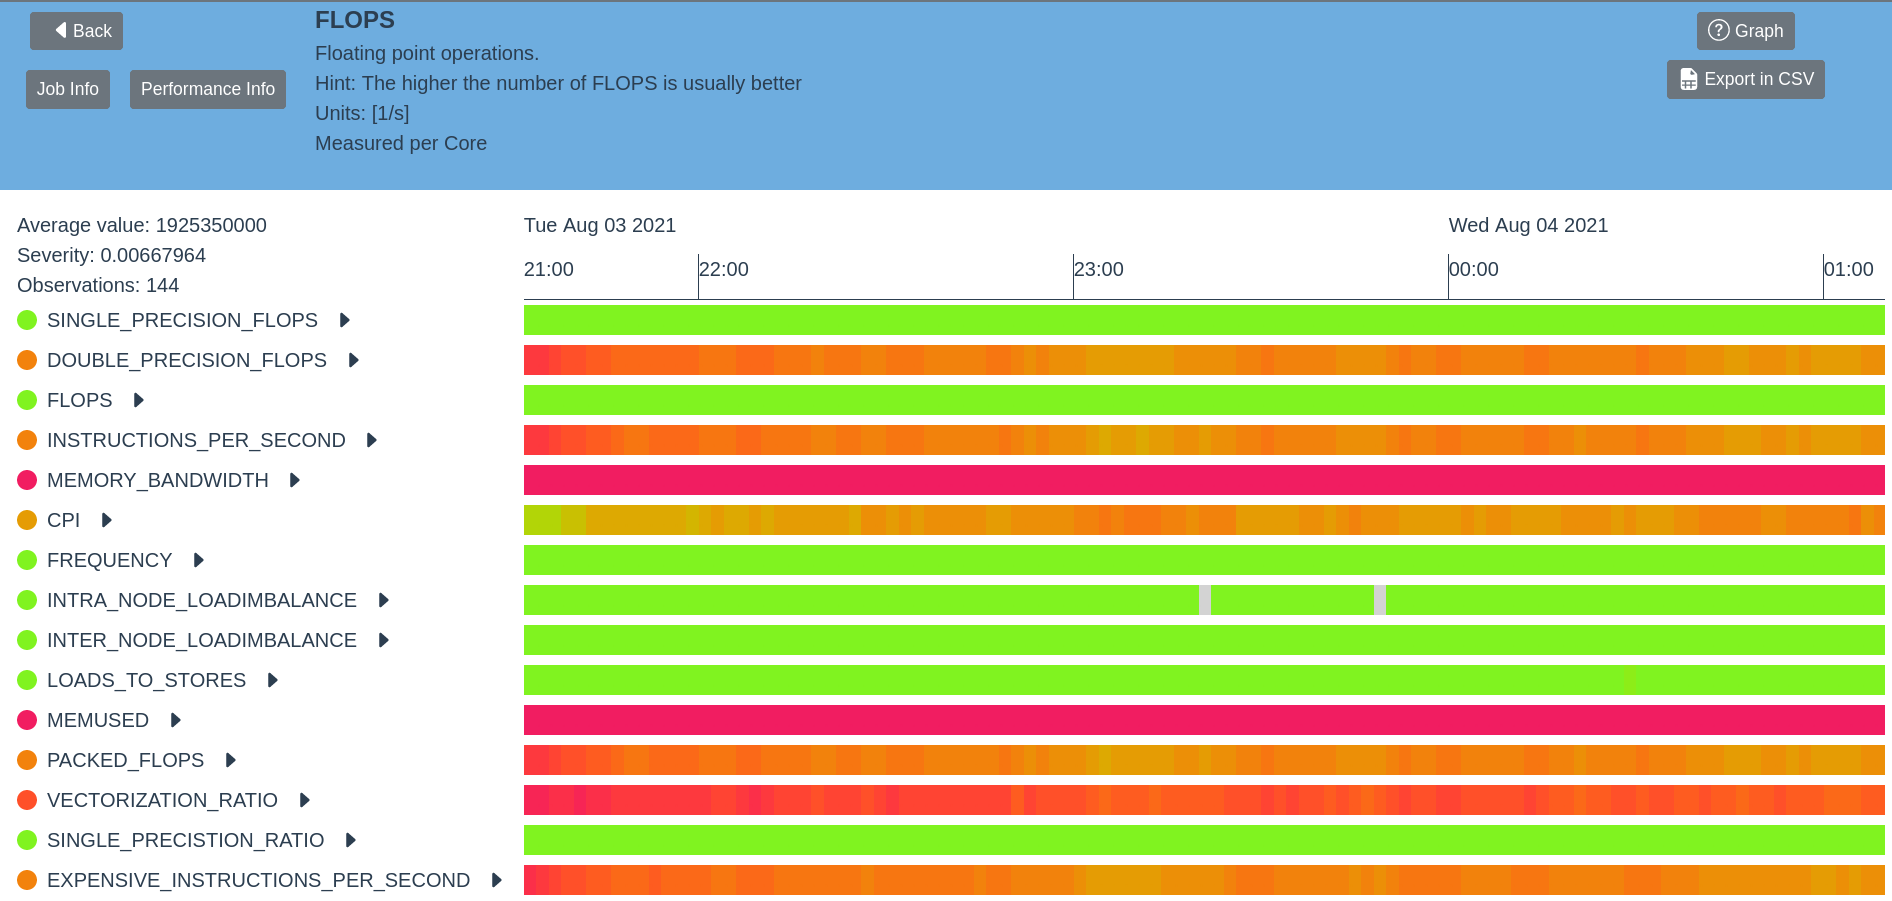
This view shows the average severity of each property over time. Every measurement is represented by a coloured rectangle, ranging from green (severity is 0) to red (severity is 1). Grey indicates that our monitoring didn't measure the property and the measurement for this timestamp is missing completely.
The list to the left shows all active properties and their hierarchy, even if some of them may have never been measured for the job. The color tag left to a property's name represents the average severity. The formula is SUM(a1 ... an)/c where a is the average severity at one timestamp, n the number of measurements of the property and c the number of measurements of the reference property (property with maximal number of measurements/occurrences over time)
- Clicking a line or a property name takes you to the Performance View.
- Hover over the property and an explanation as well as a hint for the selected property are shown above and at the bottom the timeline chart.
- Hover a cell in the chart to obtain detailed values of the cell, for example:
Average Value: 1092736
Severity: 0.453
Observations: 144
The first line shows the average value of the property. Check on the top or bottom of the timeline the property information and its units. The second line shows the severity average in a timestamp. If the property is measure per core, then we calculate an average over all cores on a timestamp, and this corresponds to a box in the Timeline chart. Finally, the third line shows the number of measurements for this timestamp - property.
Data/Performance View
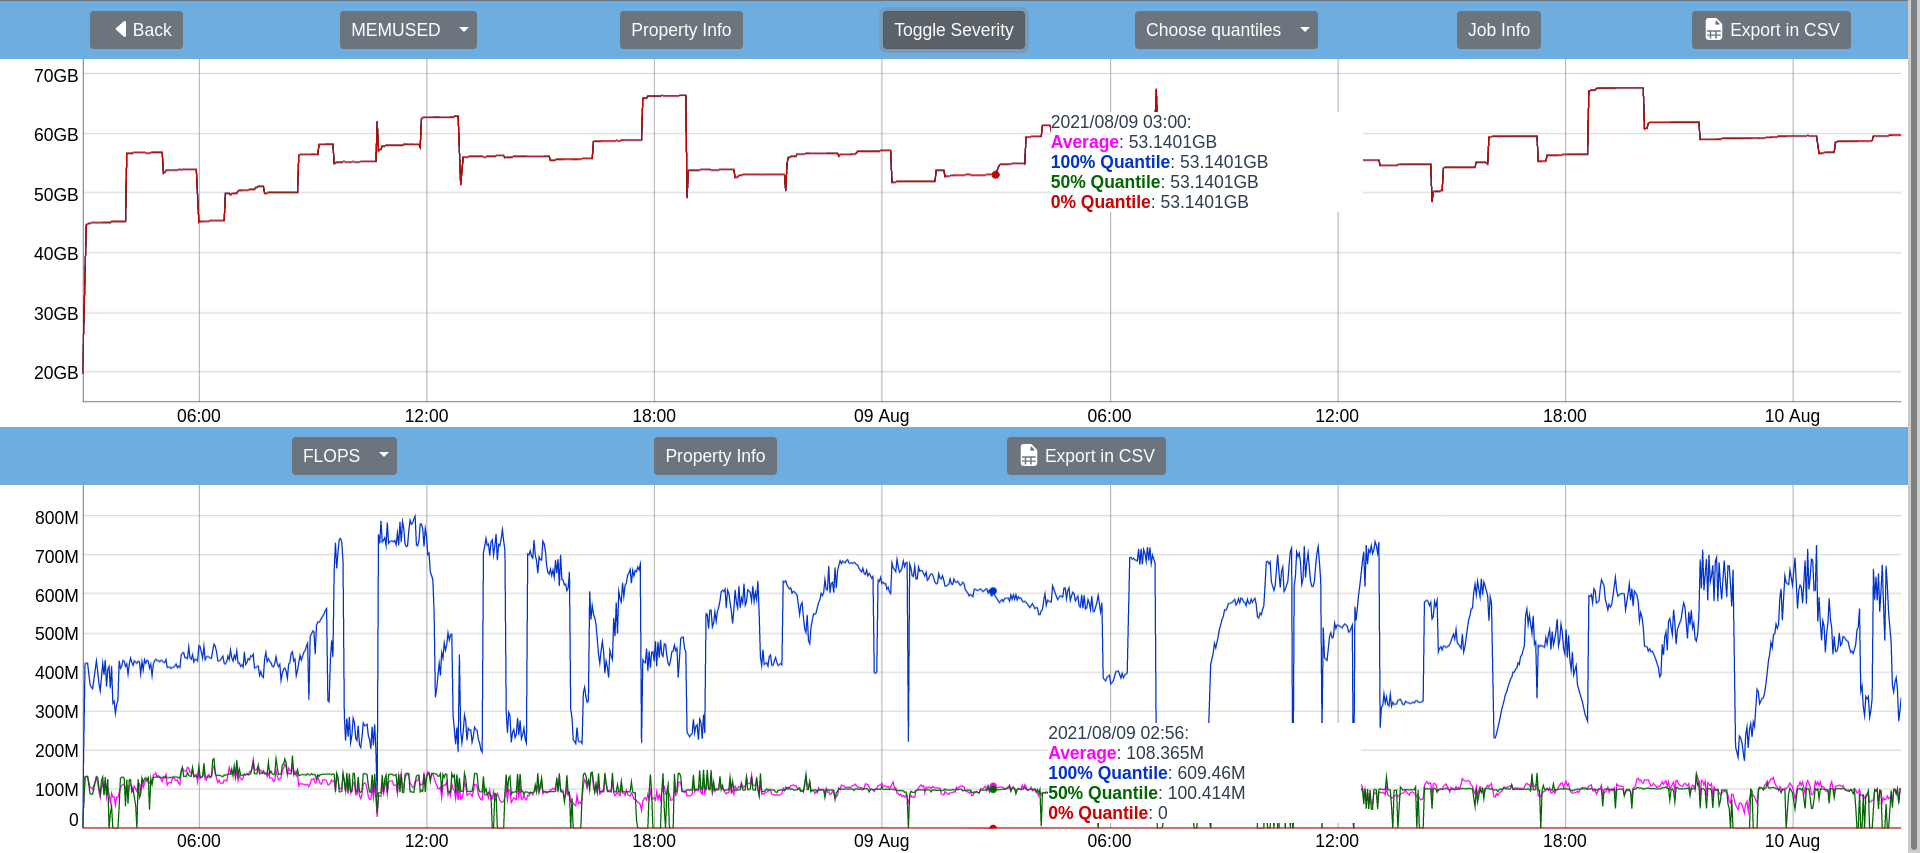
The Performance view is split horizontally to allow the comparison of the value distribution between two properties of the selected job. Each part shows a plot of values for the currently selected property and a table of the plotted data. The property for the upper part is set to the one selected in the Timeline view.
- The dropdown menu for quantiles allows the selection/deselection of all plottable data series.
- Mouse behaviour within the plot:
- Hovering shows the corresponding values
- Dragging horizontally zooms the x-axis
- Dragging vertically zooms the y-axis
- Double clicking resets zoom state of the plot
- The selector above each plot changes the currently displayed property.
- Use the "Toggle Severity" button to see the regions which are considered optimal, and regions which might indicate a bottleneck, or hint to a problem. In this case we only use two colours: pink for suboptimal, green for acceptable performance. The same rule applies as in the Average View and Timeline View, if there is something that is shown as suboptimal (i.e. red or pink), it doesn't always imply that there is a problem that needs to be fixed. This is only a hint and it would be helpful to take a closer look with other inpsection tools to check your application.
Accounting-Only View
The accounting table is activated by using the checkbox for only accounting data in both the "Filtered Search" and "Job Id Search":
You will only obtain the accounting information without the performance average table. There is a possibility below the accounting table to calculate summaries. Explore and use the "Summary options" and the "Calculate summary" button:
Example output of a summary:
You may decide that you would like to see the performance information of some of the queried jobs within the Accounting-Only View. You may still click on the Timeline column to check for individual jobs, and you can still also request the Performance Average Table by selecting the rows of interest and clicking on "Fetch".
Switching off Performance Measurements
There is a monitoring system which collects the performance metrics of your jobs in SuperMUC-NG. Some performance metrics measured from two different identities (for example: your own measurements and our monitoring system) may result in wrong results due to a conflicting use of a common register. To avoid this and if you wish to make performance measurements yourself, you can turn our monitoring off by adding this command before the start of your application (or applications) in your batch script:
In your batch script:
srun sh -c 'if [ $SLURM_LOCALID == 0 ]; then /lrz/sys/tools/dcdb/bin/perfstop.sh; fi'
Browser Compatibility
The following browsers are supported:
| Browser | Version |
|---|---|
| chrome | >= 88 |
| edge | >= 89 |
| firefox | >= 86 |
| ie | >= 10 |
| opera | >= 74 |
| safari | >= 13.1 |
Jobs which aren't monitored
Please note that some jobs will not appear in neither the basic nor the detailed report because:
- Measurements are carried out every 2 minutes beginning every day at 00:00:00. Jobs which are running less than 2 minutes might not be monitored by our tool.
- In some rare occasions the monitoring tool is switched off for all SuperMUC-NG or some of its node in order to carry out special performance measurements.
- Jobs were submitted before 2021-02-01.


